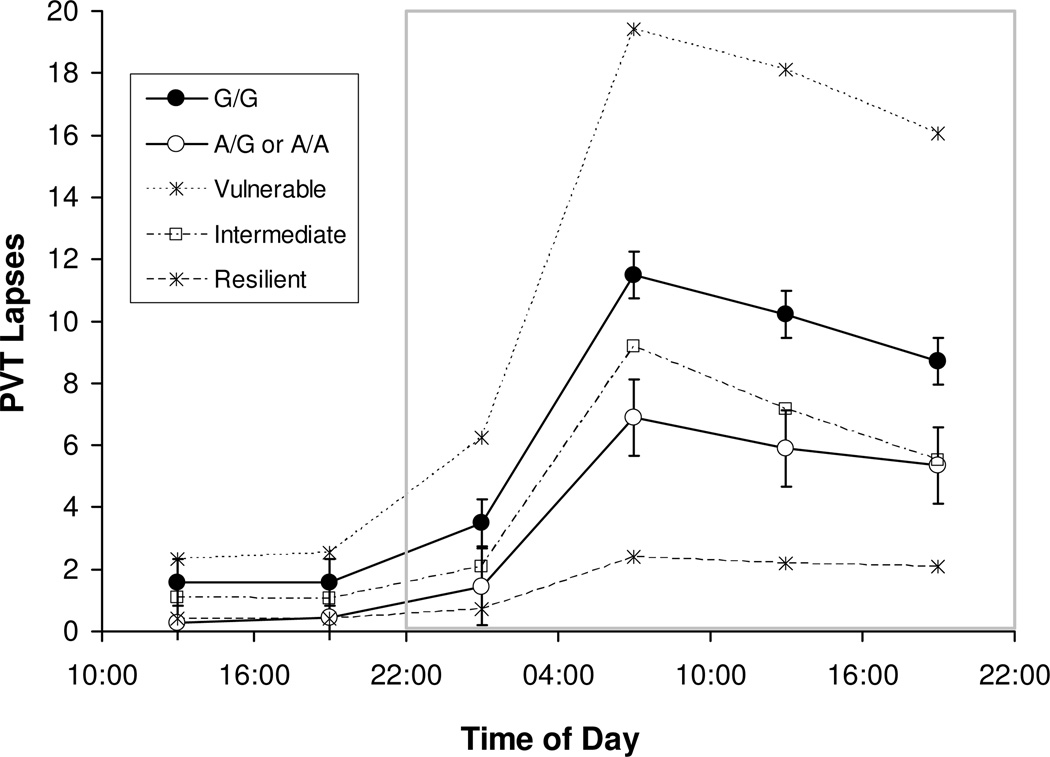
Fig. 3.
Average number of PVT lapses across consecutive 6-h intervals of sustained wakefulness for subjects with the G/G genotype versus subjects with the A/G or A/A genotypes. Error bars denote standard error. Intervals that are part of the 24-h period used to quantify vulnerability to sleep loss are enclosed in the gray box (cf. Fig. 1). For reference, the average number of PVT lapses across consecutive 6-h intervals is also shown for the most vulnerable, intermediate, and most resilient tertiles of our sample irrespective of genotype.

