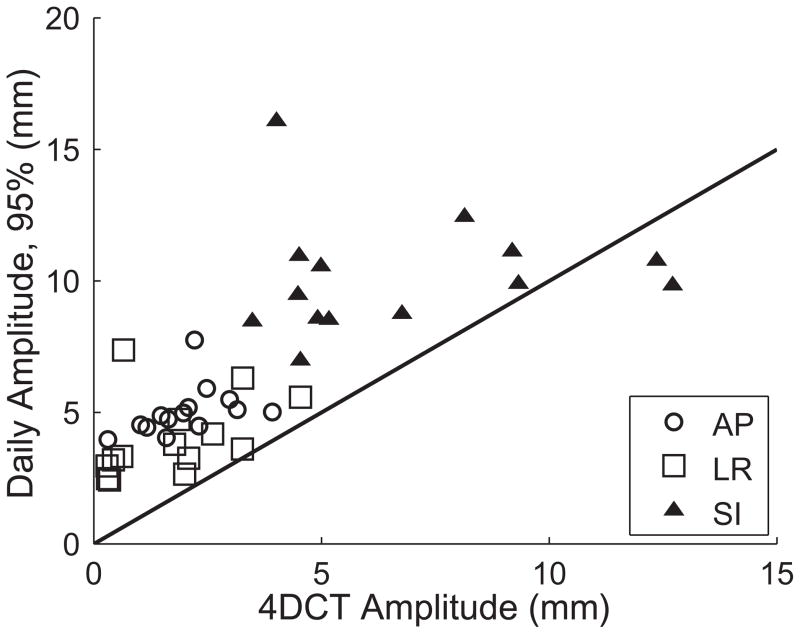
Figure 3.
Motion amplitude of pancreatic tumors in the anterior-posterior (AP), left-right (LR), and superior-inferior (SI) directions. 4DCT amplitudes were measured from pre-treatment 4DCT images. Daily amplitudes are derived from the reconstructed tumor trajectories, and are shown here as the distance encompassing 95% of the observed motion. The solid line has a slope of 1, and denotes where the data would fall if the amplitudes agreed. In nearly every case, 4DCT underestimated the amplitude of motion. In the SI direction, motion on the day of treatment exceeded the value predicted from 4DCT by an average of 3.5 mm.

