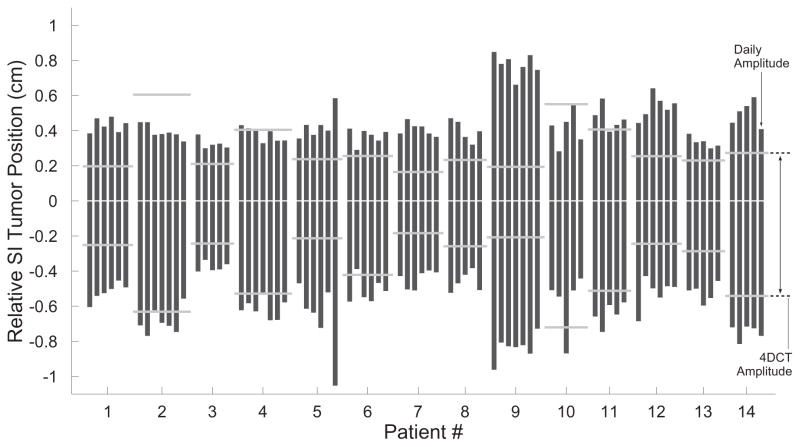
Figure 4.
Tumor trajectories in the superior-inferior (SI) direction. Each vertical box denotes the distance encompassing 95% of the daily motion during one fraction of treatment. Fractions are grouped by patient, and the horizontal bars denote the amplitude of SI motion measured in the 4DCT images for that patient. In addition to highlighting the tendency of 4DCT to underestimate pancreatic motion, these data also demonstrate the relative stability of motion in a single patient (from day-to-day), as well as the large differences in motion between different patients. Tumor position and 4DCT amplitude are shown relative to the mean position.

