
Figure 2.
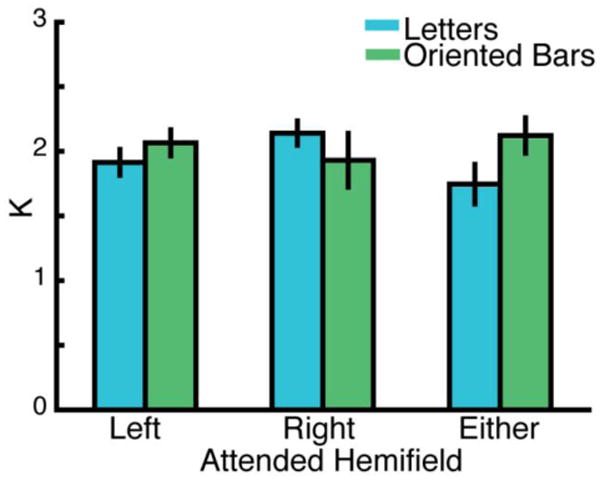
Behavioral performance reflecting the WM capacity (Cowan's K) for each stimulus type (letters, oriented bars) and for the attended hemifield at encoding (left, right, either). The bars represent the mean Cowan's K values across participants and error bars reflect the standard error of the mean. There were no significant main effects or interactions of stimulus type or hemifield, although a nonsignificant numerical trend showing stronger performance for the letter stimuli shown in the right hemifield and for the oriented bars in the left hemifield was evident.