
Figure 5.
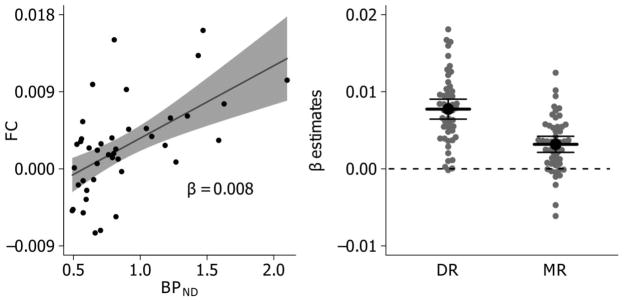
(A) Example of single-subject association between [11C]DASB BPND vs. FC with DR across 42 brain regions (see section 2.6 for details). β represents the slope estimate and shading along line represents 95% confidence interval (CI) on slope estimate. (B) Gray points reflect single subject slope estimates for each respective seed and black dots and lines reflects mean and 95% CI across subjects. The DR and MR slope estimates are mostly positive, indicating a positive association between 5-HTT binding and raphe FC in the vast majority of individuals.