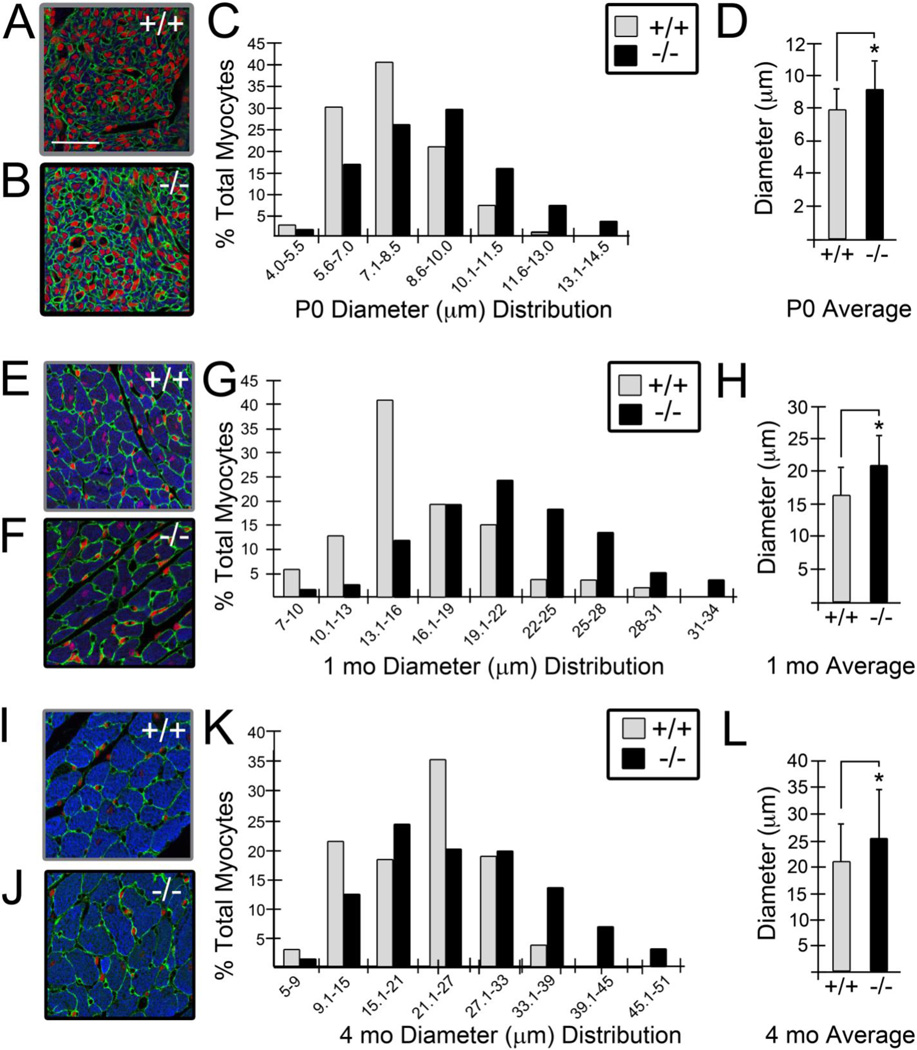
Figure 3. Cardiomyocyte size was increased in lumican deficient mice.
The diameter of α -sarcomeric actin positive cardiomyocytes (blue, A, B, E, F, I, J) was measured in left ventricular (LV) tissue of lum−/− and WT littermate hearts at postnatal day 0 (P0, A–D; n=4 WT, n=4 lum−/−), 1 month (1 mo, E-H; n=5 WT, n=8 lum−/−) and adult (4 mo, I-L; n=3 WT, n=3 lum−/−). The graphs in C, G, and K show the percentage of total cardiomyocytes (Y-axis) that fall into the size (μm) range of diameter groups designated on the X-axis. The average size of the cardiomyocytes in the LV of lum−/− was significantly larger than WT at P0 (D), 1 mo (H) and 4 mo (L). Error bars in D, H, L, show standard deviation of cardiomyocyte diameters. * -denotes statistical significance: D, P < 1.1 X 10⁻⁸ ; H, P < 2.3 X 10⁻⁵ ; L, P < 9.4 X 10⁻⁶ . Grey bars denote WT and black bars designate lum−/− measurements. Green-A, B, E, F, I and J, shows laminin immunolocalization, red propidium iodide, and blue-α sarcomeric actin. Magnification bars: A = 50 μm and applies to B, E, F, I and J.

