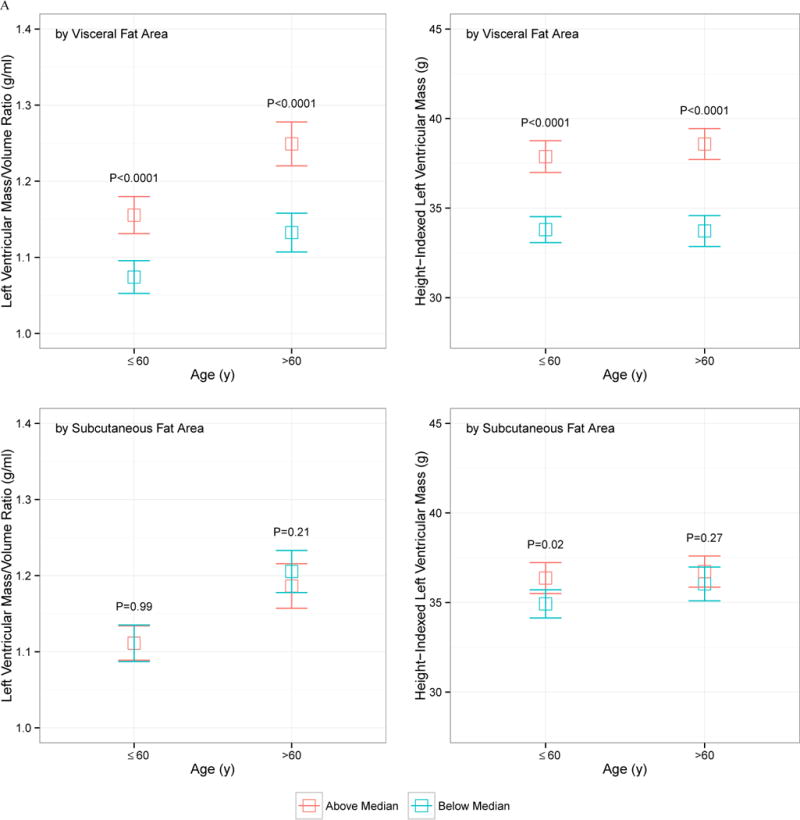
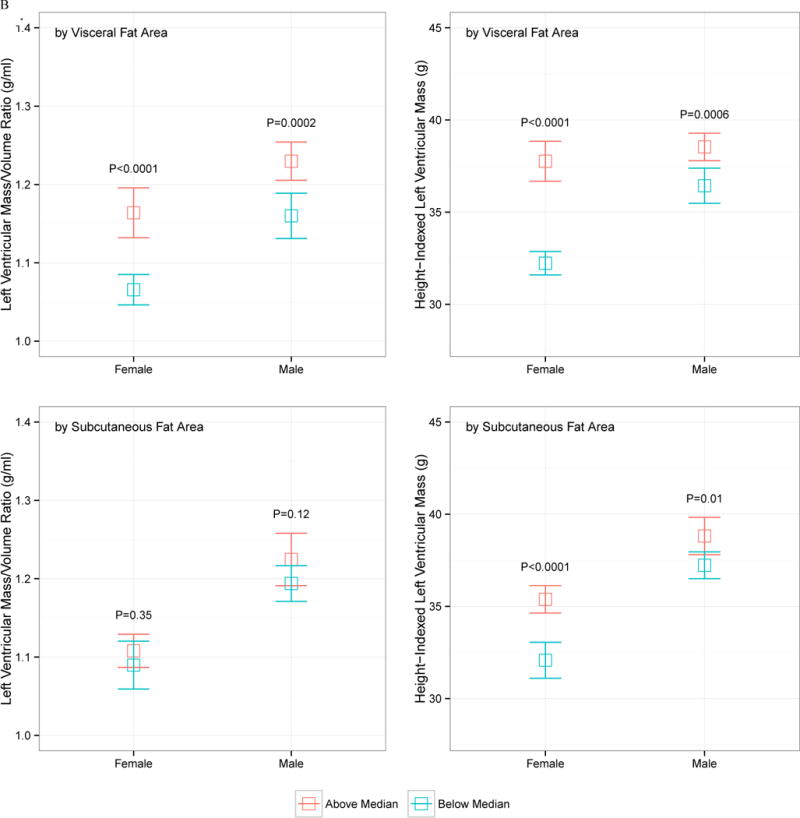
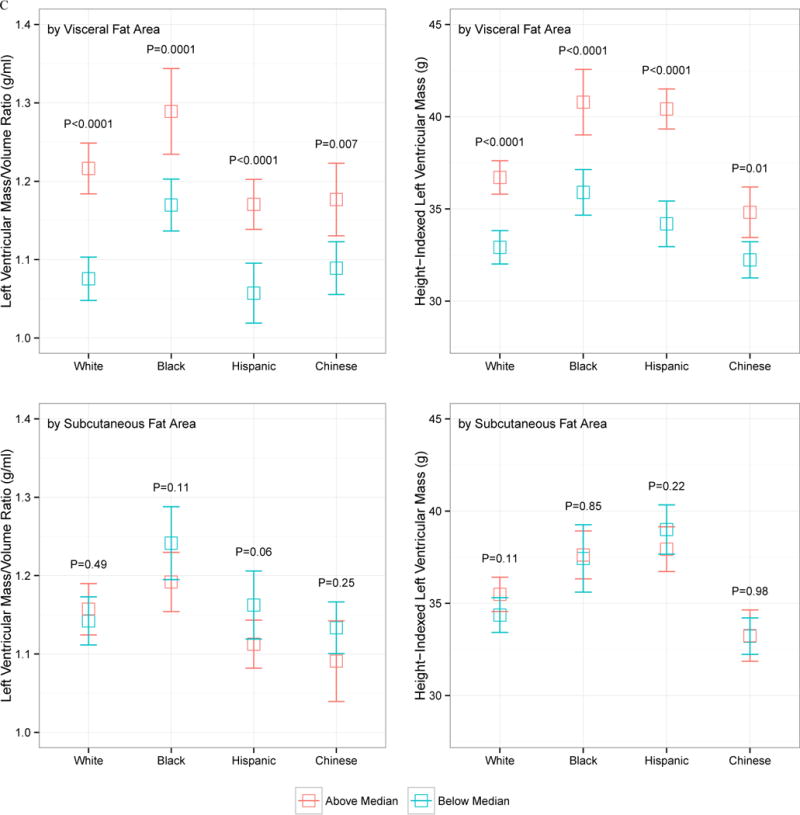
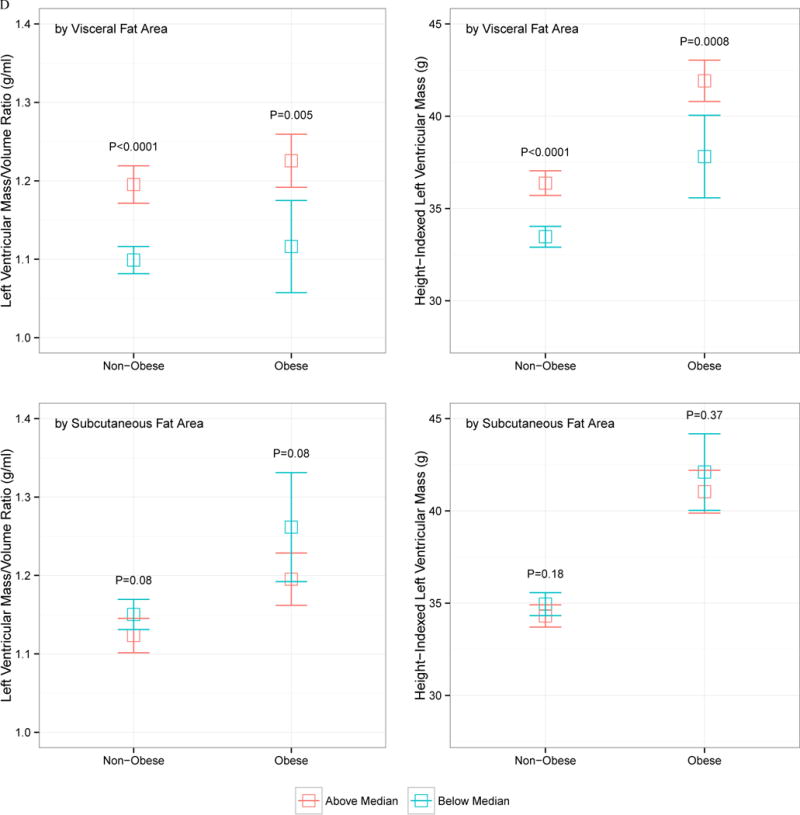
Figure 1.


Indexed left ventricular mass and left ventricular mass-to-volume ratio, stratified by above and below median visceral or subcutaneous fat area, by age (A), sex (B), race (C), or obesity status (D; obese > 30 kg/m2). The error bars represent 95% confidence interval around the mean, and P values represent comparison of above- and below-median VF or SQ fat area value
