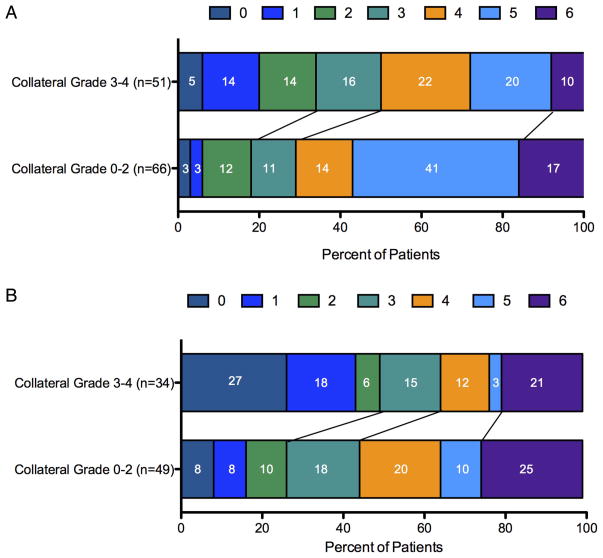
Figure 2.
Distribution of modified Rankin scores (mRS) by dichotomized collateral scores on presentation. (A) mRS at discharge for the cohorts of patients presenting with collateral grades 3–4 vs 0–2 (4±1.7 vs 5±1.6, p<0.01, Mann–Whitney U test). (B) mRS at 90 days for the cohorts of patients presenting with collateral grades 3–4 vs 0–2 (2.5±2.3 vs 4±1.9, p=0.03, Mann–Whitney U test). Values were available for a subset of the cohort, as indicated in parentheses. For both figures, numbers in white indicate the percentage of patients within each category.

