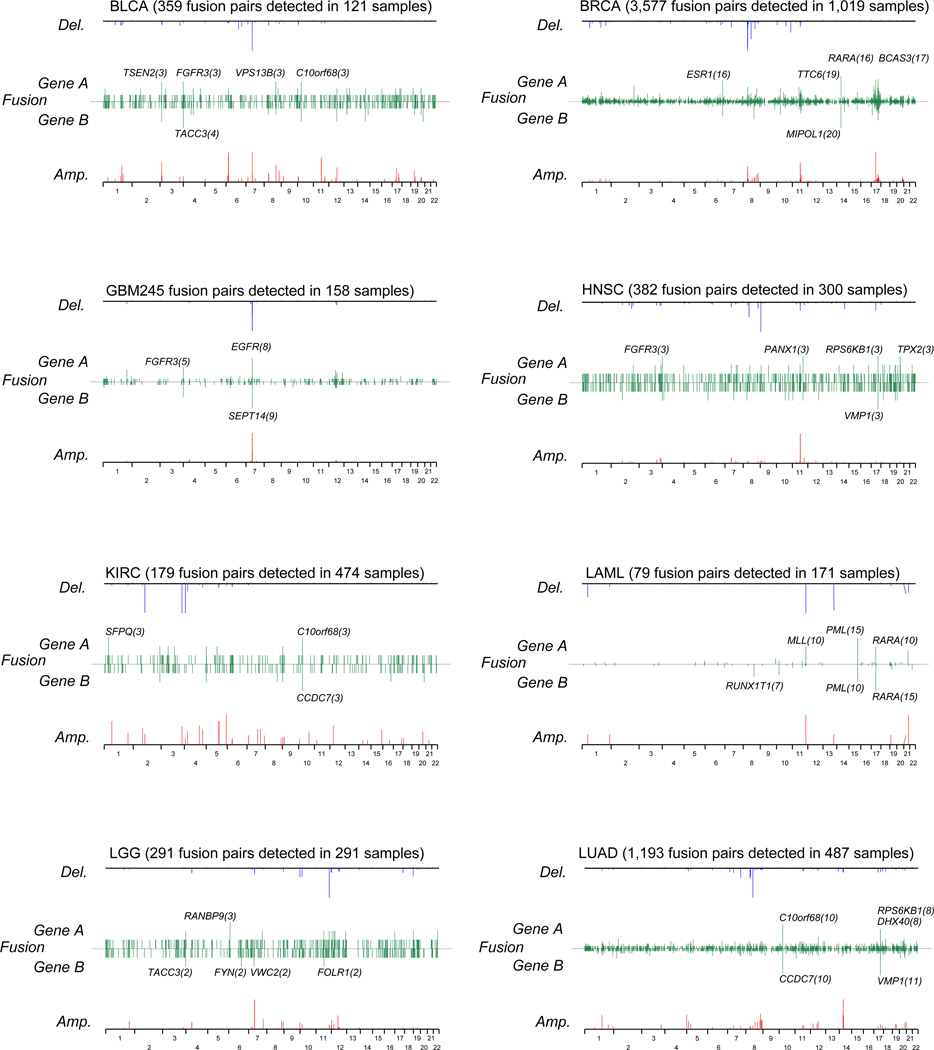
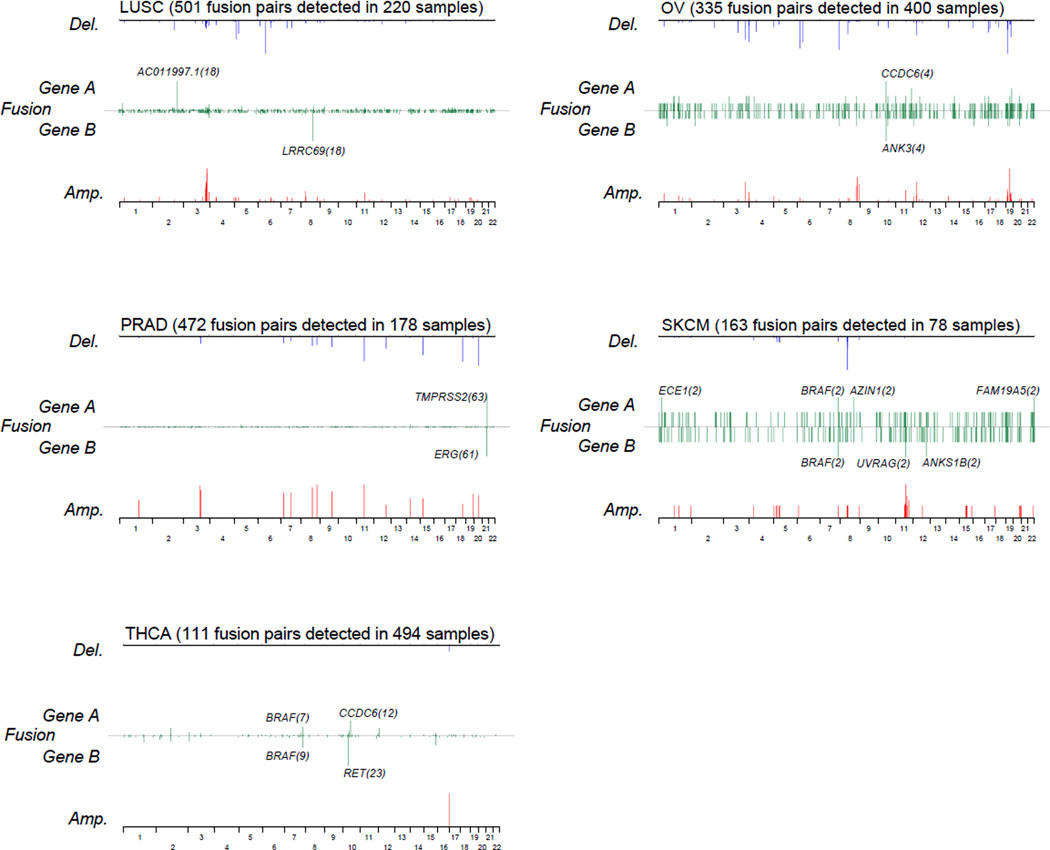
Figure 2. The chromosomal location of recurrent fusion genes for each tumor types.
Line plots representing the frequency of fusion gene A and B across the genome (green), the negative log (q-value) of DNA amplifications (red) and deletions (blue) per tumor type.
DNA copy number alterations with q-value less than 0.05 as determined by GISTIC are shown.


