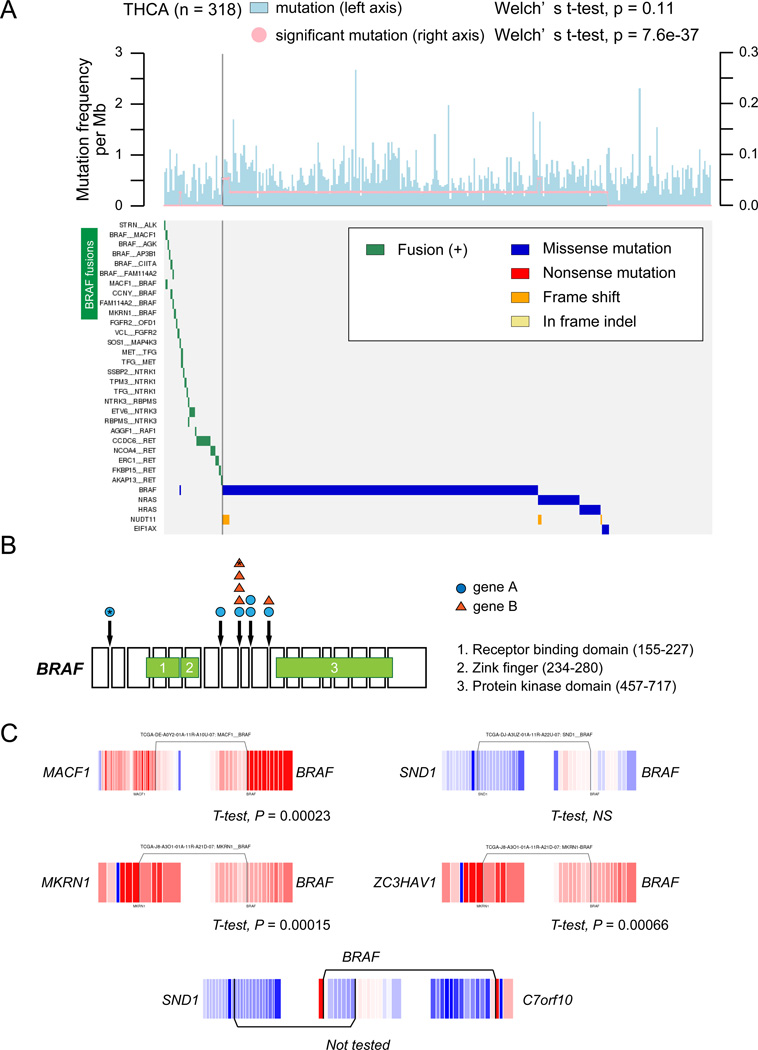
Figure 4. Significance of RAF family fusions in thyroid cancer.
(A) The top panel indicates frequencies of somatic mutations (lightblue) and significant mutations (pink). To compare the frequency between samples with and without recurrent fusions (n≥2), a Welch’ s t-test was performed. The bottom panel shows a heatmap of fusions and significant gene mutations in 312 thyroid cancers. (B) Position of each domain in BRAF gene and junction points of BRAF fusions. (C) Exon expression plots demonstrated Z-normalized exon expression for each exon in thyroid cancers. Red and blue represent relatively high and low exon expression.

