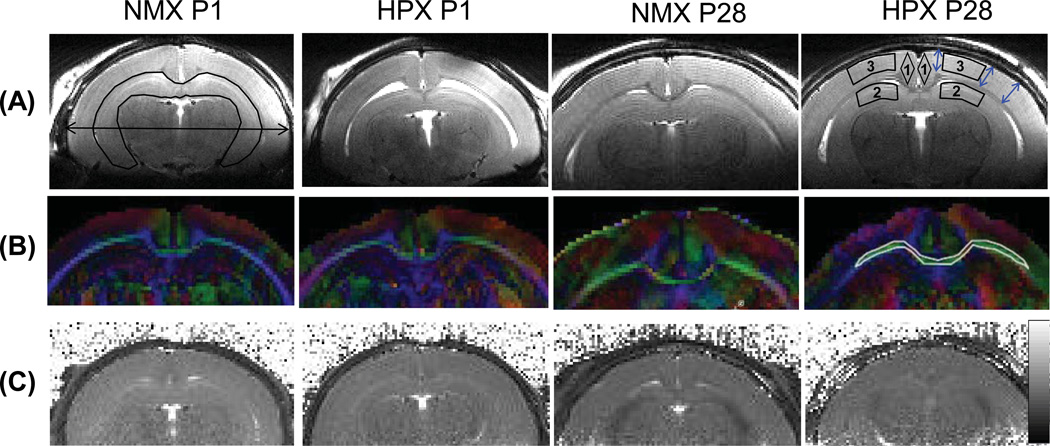
Figure 2.
MR images of guinea pig brains in the NMX and HPX groups at postnatal day 1 (P1) and 28 (P28). (a) High resolution T2-weighted images during brain development of guinea pigs. The ROI of the hippocampus and a double-headed arrow indicating maximum brain width measurements are shown in the NMX P1 image (top, leftmost). The ROIs for T2 sampling are shown in the ‘HPX P28’ image: 1) cingulate, 2) hippocampus and 3) cortex, and three double-headed blue arrows indicate areas where cortical thickness was measured. (b) RGB fractional anisotropy (FA) maps corresponding to high resolution T2-weighted images in (a). An ROI of the corpus callosum is shown in the P28 HPX image (middle, rightmost). Colors indicate different diffusion directions: red for x (left to right), green for y (caudal-rostral) and blue for z (anterior-posterior). (c) Corresponding T2 maps at P1 and P28 of a normoxic and a hypoxic brains. The gray scale bar on the right indicates T2 values between 10–100 ms.

