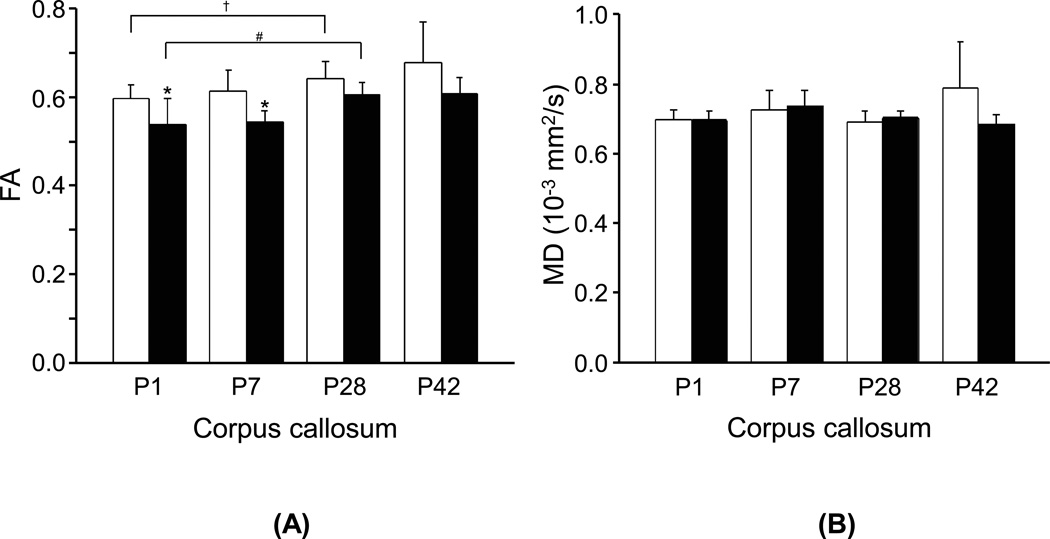
Figure 3.
Comparisons of (a) FA and (b) MD values from the corpus callosum of guinea pig brains between the NMX (□) and HPX (■) groups at postnatal days 1 (P1), 7 (P7), 28 (P28) and 42 (P42). (*) indicates significant differences (p < 0.05) between the HPX and NMX groups at each age. (#) and (†) indicate significant longitudinal differences (p < 0.05) between P1 and P28 in the HPX and NMX groups, respectively.

