
Fig 5. Pb-induced caspase-3 activation in cardiovascular tissue.
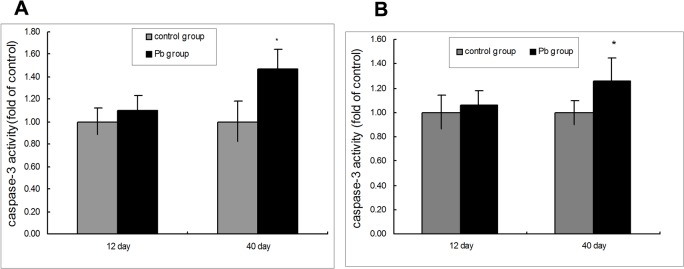
(A) Caspase-3 activity in rat vascular following Pb exposure. (B) Caspase-3 activity in rat cardiac tissue following Pb exposure. The rats were treated with 1% Pb acetate for 12 and 40 days. n = 6. Data are the means ± SD. *p < 0.05 compared with the control group. The relative activities of caspase-3 shown are calculated from the average of experiment. Each value was expressed as the ratio of caspase-3 activation level to the control level, and the value of the control was set to 1.