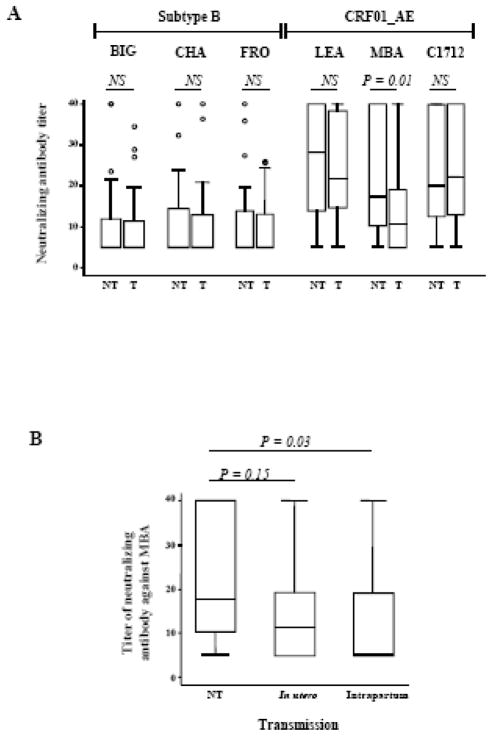
Figure 1. Comparison of neutralizing antibody titers in transmitting (T) and nontransmitting (NT) mothers.
(A) Comparison of NAb titers against the six strains in transmitting and nontransmitting mothers. Box plots show the distribution of maternal antibody titers; for each distribution, the horizontal lines represent the lower adjacent 25th, median, 75th, and upper adjacent percentiles. (B) Comparison of NAb titers against the MBA strain in nontransmitting mothers and transmitting mothers according to time of transmission (in utero or intrapartum). Nab titers were compared using the Wilcoxon matched-pairs signed-ranks test. NS: not significant.

