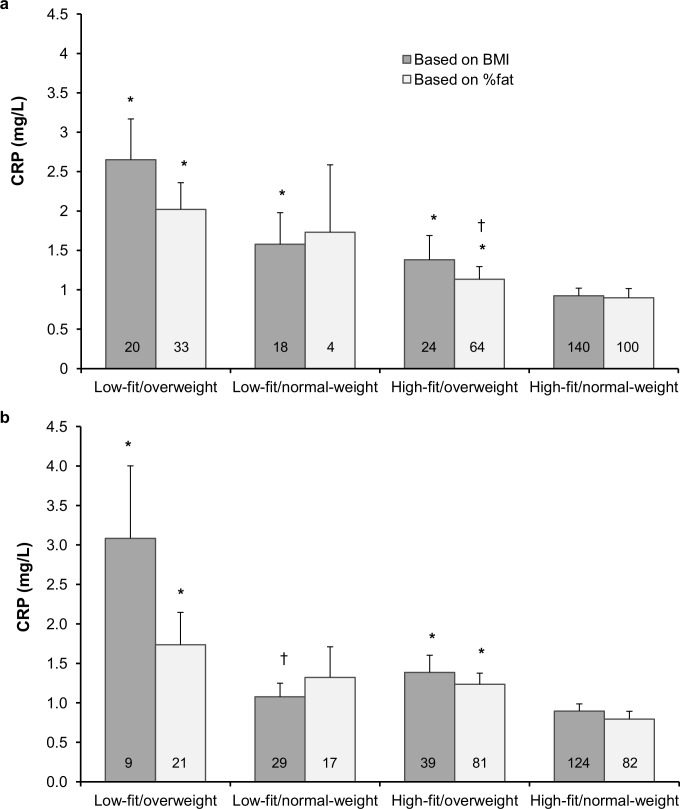
Fig 1. Comparison of CRP values across the fit-fat groups based on maximal oxygen uptake (a) and maximal oxygen uptake relative to the fat-free mass (b).
Values are means and SE. Numbers in bars represent the number of participants in each group. CRP = C-reactive protein, BMI = body mass index, %fat = body fat percentage, *Significantly different from the high-fit/normal-weight group, p < 0.05. †Significantly different from the low-fit/overweight group, p < 0.05.

