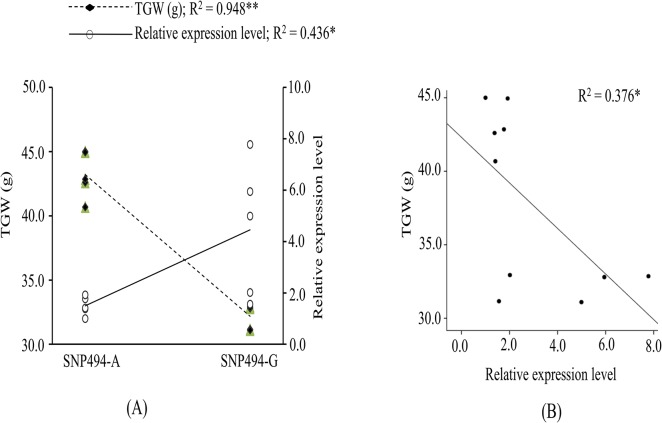
Fig 5. Plot showing significant regression of (A) TaGW2-6A expression level and thousand grain weight (TGW) in genotypes with two different alleles (A and G) of SNP-494 identified in promoter region, and (B) TGW with relative expression level in same genotypes.
* and ** indicate significance at 0.05 and 0.01 levels, respectively.

