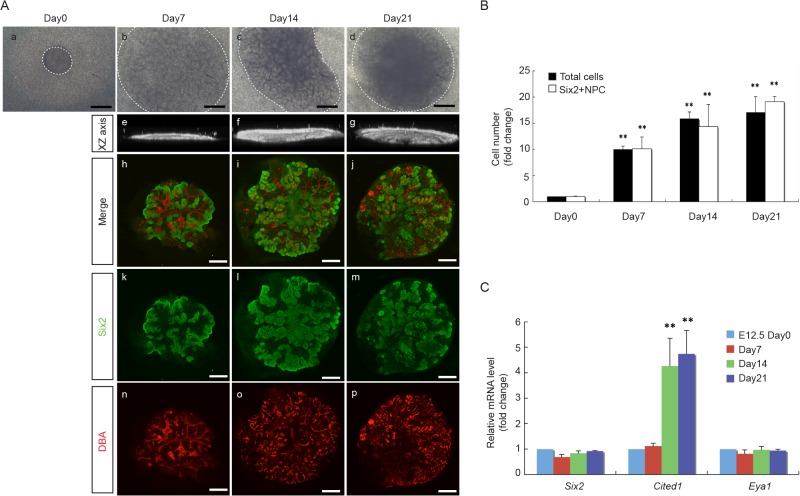
Fig 3. Long term maintenance of NPC in aggregates.
(A) Morphology of representative E12.5 aggregates at day1, 7, 14 and 21 in culture. The size of aggregates increased with time (a-d), and the morphology of the aggregates changed from more flattened by day 7 to more three-dimensional after day 14, as demonstrated by the confocal XZ axis pictures (e-g). Immuno-staining for NPC marker, Six2 (green), and UB marker, DBA (red), shows the expansion of Six2+ NPC surrounding UB structures from day 7 up to day 21 in culture. (Scale bar = 500 μm). (B) The number of total cells and Six2+NPC in E12.5 aggregates increased in parallel from day 0 to day 7, 14 and 21, and plateaued after day 14. Data are presented as fold changes from respective cell number at day 0. (n = 3, ** p < 0.01 vs. day 0). (C) mRNA expression levels of NPC marker genes in E12.5 aggregates at day 0, 7, 14 and 21. qRT-PCR results showed a significant increase in Cited1 mRNA expression levels at day 14 and 21, while the mRNA expression levels of Six2 and Eya1 remained unchanged from day 0 to 21. Data were normalized by Gapdh expression levels and presented as fold changes from day 0. (n = 3, ** p < 0.01 vs. day 0)

