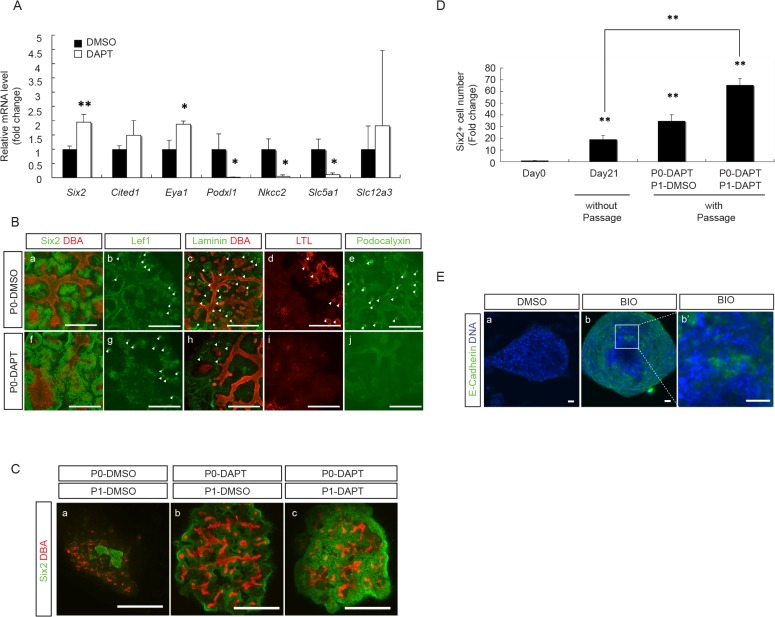
Fig 10. DAPT treatment enabled further expansion of NPC in P1 aggregates.
(A) qRT-PCR results from E12.5 aggregates after treatment with either DMSO or DAPT for 7 days show a significant increase in NPC marker genes (Six2 and Eya1) and a significant decrease in differentiated MM cell marker genes (Podxl1, Nkcc2 and Slc5a1, but not Slc12a3) in DAPT-treated aggregates as compared to DMSO-treated aggregates. All data were normalized by Gapdh expression levels and presented as fold changes from DMSO treated. (n = 3, * p < 0.05, ** p < 0.01). (B) Immuno-staining of representative E12.5 aggregates, after 7 days in culture with either DMSO or DAPT, for: NPC marker, Six2 (green)/UB marker, DBA (red) (a,f); renal vesicle marker, Lef1 (green) (b,g); epithelial marker laminin (green)/UB marker, DBA (red) (c,h); proximal tubule marker, LTL (red) (d,i); podocyte marker, pdocalyxin (green) (e,j), shows increased abundance of Six2+ NPC(f), with reduced laminin+- (h), LTL+- (i) and podocalyxin+- (j) epithelial structures in DAPT-treated aggregates as compared to DMSO-treated aggregates. White arrowheads indicate structures that are positive for respective markers. (Scale bar = 500μm). (C) Immuno-staining of representative P1 aggregates that were treated with either DMSO or DAPT during P0 and P1 periods for NPC marker, Six2 (green), and UB marker, DBA (red), shows that DAPT-treatment during P0 period alone increased the abundance of NPC in P1 aggregates (b vs. a). The number of NPC was further expanded by continuing DAPT treatment during both P0 and P1 periods (c vs. a&b). (Scale bar = 500μm). (D) Six2+-NPC number increased by 20-fold in aggregates without passage after 21 days in culture as compared to that in the E12.5 embryonic kidneys at day 0. This was further increased to 35- and 65-fold by passage with DAPT treatment during P0 period alone and during both P0 and P1 periods, respectively. (n = 3, ** p < 0.01 vs. day 0 and day 21). (E) Aggregates from Six2-TGC mouse E12.5 embryonic kidneys were treated with DAPT during both P0 and P1 periods, and the Six2-GFP+ cells from these P1 aggregates were collected by FACS sorting and used to reconstitute aggregates for another 24 hour incubation with either DMSO or BIO. After being cultured for another 5 days without treatment, these aggregates were immuno-stained for epithelial cell marker, E-cadherin (green). Results from two representative aggregates show that treatment with BIO (b, b’), but not DMSO (a), induced E-cadherin expression, indicating that Six2+ NPC from these P1 aggregates retained their potential to respond to Wnt signal to become epithelial cells. (b’) is a higher power view of (b) showing the induced E-cadherin+-epithelial structures by BIO treatment. (Scale bar = 20 μm)

