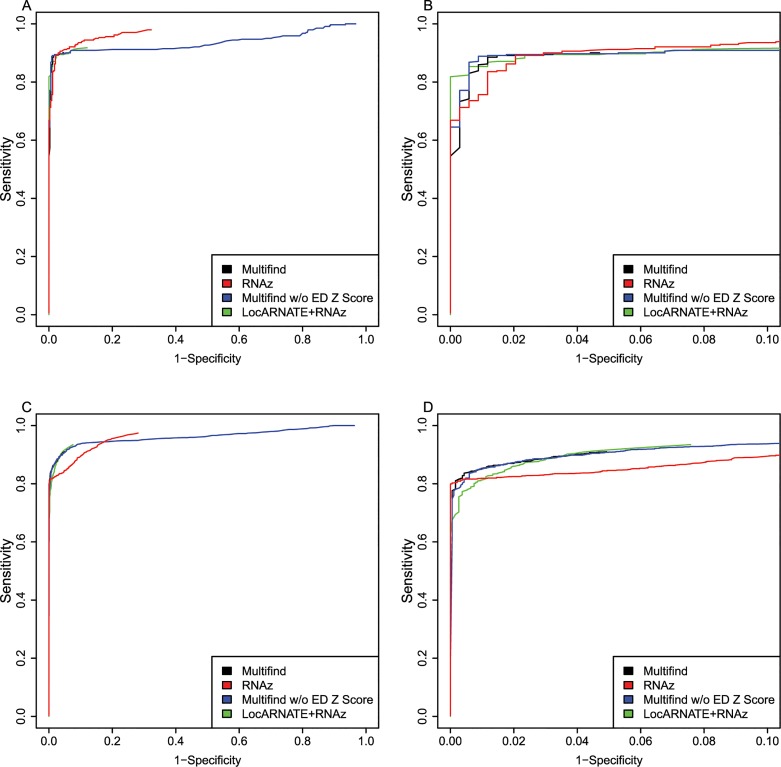
Fig 7. ROC curves for benchmarks on high and low entropy ranges of the second RFAM test.
(A) ROC curves for Multifind, Multifind trained without ensemble defect Z score, RNAz, LocARNATE+RNAz and Dynalign/SVM on the low-entropy range (<0.3) of the second testing set. (B) The high-specificity range of the ROC curves for Multifind, Multifind trained without ensemble defect Z score, RNAz, LocARNATE+RNAz and Dynalign/SVM on the low-entropy range (<0.3) of the second testing set. (C) ROC curves for Multifind, Multifind trained without ensemble defect Z score, RNAz, LocARNATE+RNAz and Dynalign/SVM on the high-entropy range (>0.3) of the second testing set. (D) The high-specificity range of the ROC curves for Multifind, Multifind trained without ensemble defect Z score, RNAz, LocARNATE+RNAz and Dynalign/SVM on the high-entropy range (>0.3) of the second testing set.

