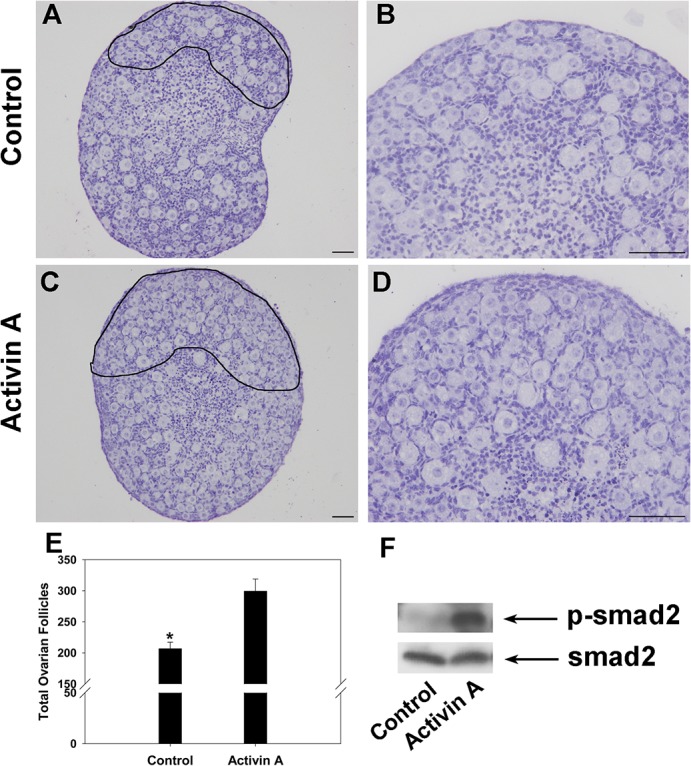
Fig 7. Phenotypes of ovary cultures treated with ACT A.

Ovaries at 17.5 dpc were cultured for 7 days without treatment (as a control) or with 100 ng/mL ACT A. Compared to control ovaries (A, black boundary enlarged in B), there were significantly more primordial follicles in the periphery of ovaries treated with ACT A (C, black boundary enlarged in D). The total number of ovarian follicles in the largest cross-section of control and ACT A-treated ovaries were quantified (E). Western blot analysis revealed an obvious increase of the p-smad2 level in Activin A-treated ovaries relative to control group (F). Scale bars: 40 μm (A-D). Smad2 was measured as internal control. Significant differences are indicated by * (P < 0.05).
