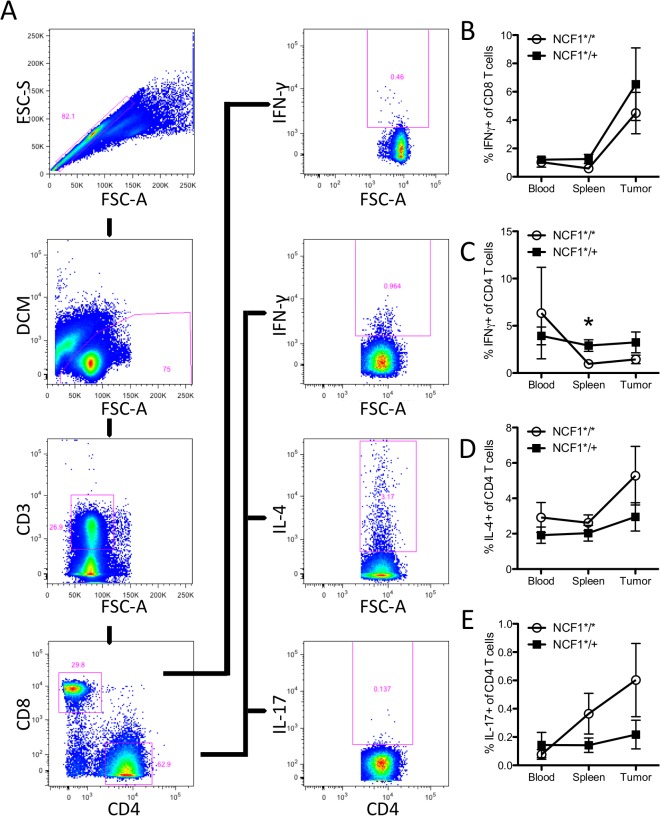
Fig 4. No difference was found between tumor bearing NCF1*/* and NCF1*/+ mice in T cell cytokine production.
(A) Single cell suspensions of blood, spleen and tumor samples were stimulated with PMA for one hour followed by three hours with GolgiPlug prior to intracellular staining. T cells were gated as follows; singlet to live to CD3 positive and the split on CD4 or CD8 positive cells. (B) Intracellular IFN- γ response in CD8+ T cells. (C) Intracellular IFN- γ response in CD4+ T cells. Mann-Whitney statistical test; * P < 0.05. (D) Intracellular IL-4 response in CD4+ T cells. (E) Intracellular IL-17 response in CD4+ T cells (E).

