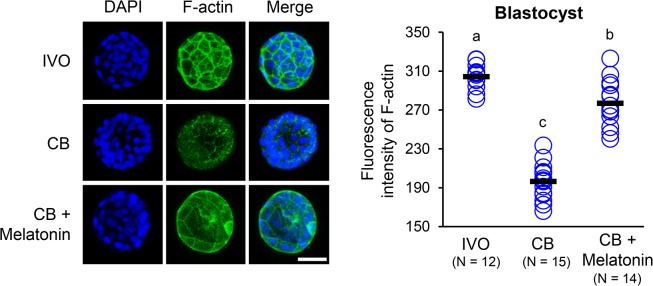
Fig 4. Effect of CB and/or melatonin on the distribution and organization of F-actin.

Immunofluorescence analysis to detect F-actin (green) in the blastocysts of CB (10 μg/mL) and/or melatonin-treated (10−9 M) groups. Nuclei (blue) are stained with DAPI. Bar, 50 μm. Each circle represents the fluorescence intensity in each embryo. Horizontal lines represent the mean values. The number of embryos in each group is indicated. Different superscript letters (a, b, c) indicate significant differences (P < 0.05).
