
Fig 6. Subjective confidence is updated appropriately on a trial-by-trial basis.
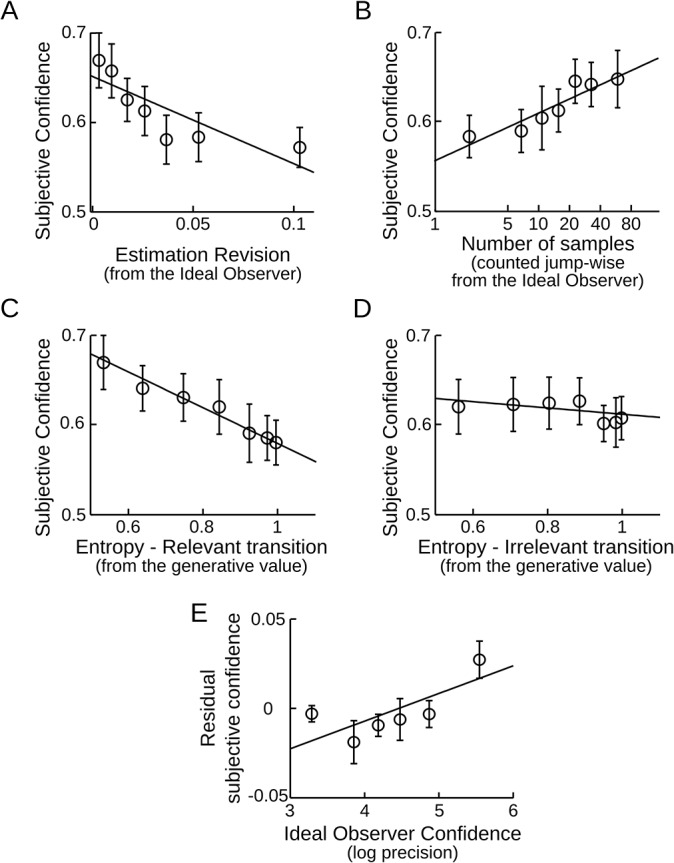
(A) Confidence varies inversely with model revision. The revision of probability estimates corresponds to the shift (absolute difference) in transition probabilities estimated by the Ideal Observer, between two consecutive observations of this transition. (B) Confidence increases when there is more information. Mathematically, confidence should increase linearly with the log-number of samples within stable periods; thus a log-scale is used to plot subjective confidence. The sample count was reset each time the Ideal Observer detects a new jump. (C, D) Confidence is reduced when transitions between stimuli are less predictable. The entropy reflects how unpredictable the next stimulus is based on the generative transition probability: p(A|A) or p(A|B). If the stimulus preceding the question is A, the relevant transition entropy is determined by p(A|A). By contrast p(A|B) is irrelevant. (E) Evidence that subjective confidence estimation goes beyond all of the above factors taken together. A multiple regression including the factors in panels A to D was used to compute the residual subjective confidence, which was then correlated with the Ideal Observer confidence. In all plots error-bars give the inter-subject mean ± s.e.m; the fitted line is the average of the linear fits performed at the subject level. Bins are used only for visualization and not for data analysis.