
Fig 8. Expression of inflammatory activation-related markers.
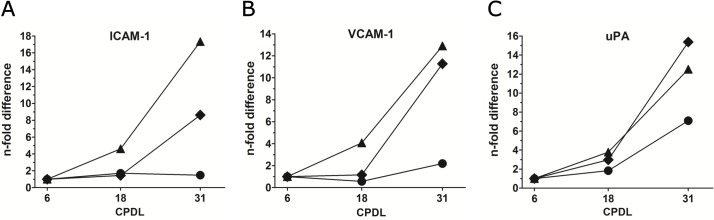
Quantitative RT-PCR analysis was performed on total cellular mRNA isolated from 3 donors at 6, 18, and 31 CPDL. Gene expression levels of ICAM-1 (A), VCAM-1 (B), and uPA (C) in individual donors PB15 (◆), PB84 (●), and PB224(▲), during long-term expansion. Analysis of uPA expression was performed with the same data set as depicted in Fig 7A. Data are expressed as n-fold difference of expression of same genes in cells at 6 CPDL.