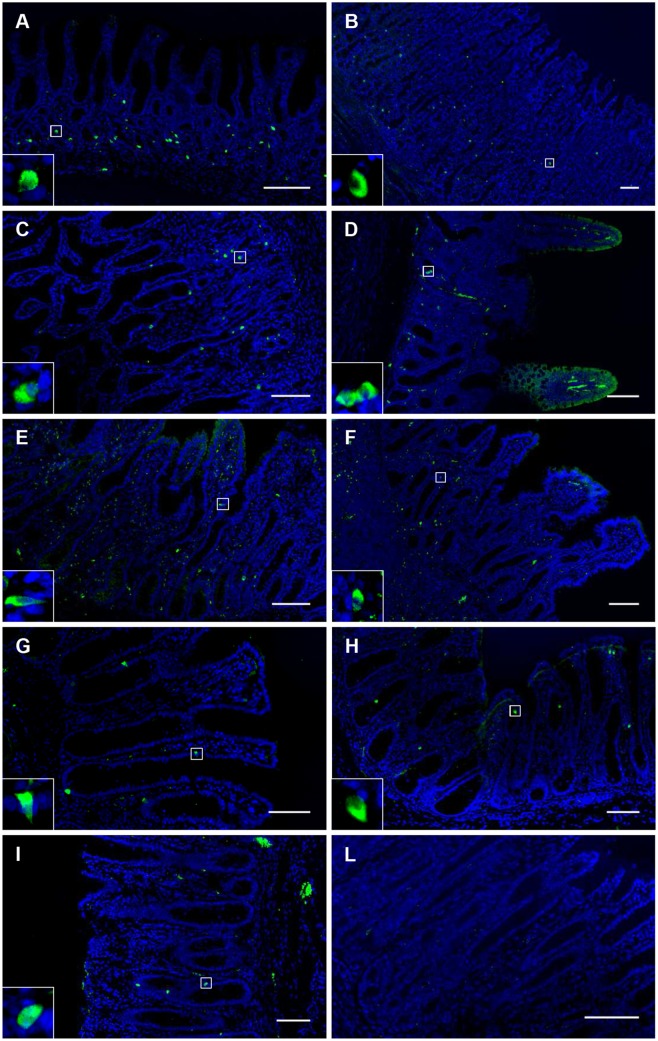
Fig 1. Visualization of OR51E1 tissue distribution in the gastrointestinal tract.
A = cardia, B = fundus, C = pylorus, D = duodenum, E = jejunum, F = ileum, G = cecum, H = colon, I = rectum, L = pylorus, control (without primary antibody). Scale bar = 100 μm. The OR51E1 immunostaining distribution is mostly in the bottom half of the mucosa in each tissue. There is a higher density of OR51E1+cells found in the gastric mucosa (A–C) with a peak density in the pylorus (C). The morphology of the OR51E1+ cells, as magnified in a small square on each picture is generally of the close-type with a round shape but sometimes they show an open-type morphology with a triangular shape (e.g. Fig 1, E, G, H), particularly in the top half of the mucosa, closer to the lumen.

