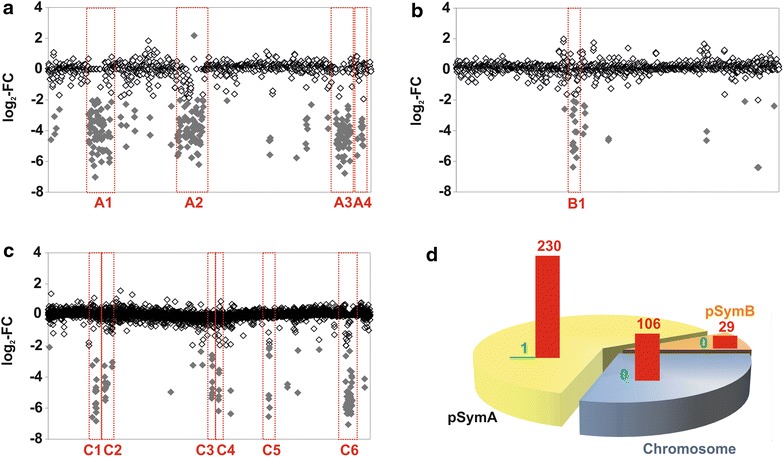
Figure 1.

Genomic clusters missing from S. meliloti AK21, identified by comparative genome hybridization. Labeled total DNA from S. meliloti AK21 was competitively hybridized with labeled DNA isolated from S. meliloti 1021 on an Sm14kOligo microarray. Statistically significant signals (p value <0.05) are shown individually for the megaplasmid pSymA (a), chromid pSymB (b) and the chromosome (c), respectively. The y-axis shows the log2-fold change (M value), corresponding to the base 2 logarithm of the ratio of intensities between Rm1021 and S. meliloti AK21 intensity signals. Genes are represented along the x-axis, in the order of their NCBI-annotated location on the corresponding replicon. Genes with an M-value below -2 or greater than 2 are highlighted as grey diamonds and the missing gene clusters are boxed in red. d Diagram representing the distribution of variable genes between the three replicons: chromosome, pSymB chromid and pSymA megaplasmid. Vertical bars indicate the number of genes with a major number of copies (in green) and absent or highly divergent genes (in red).
