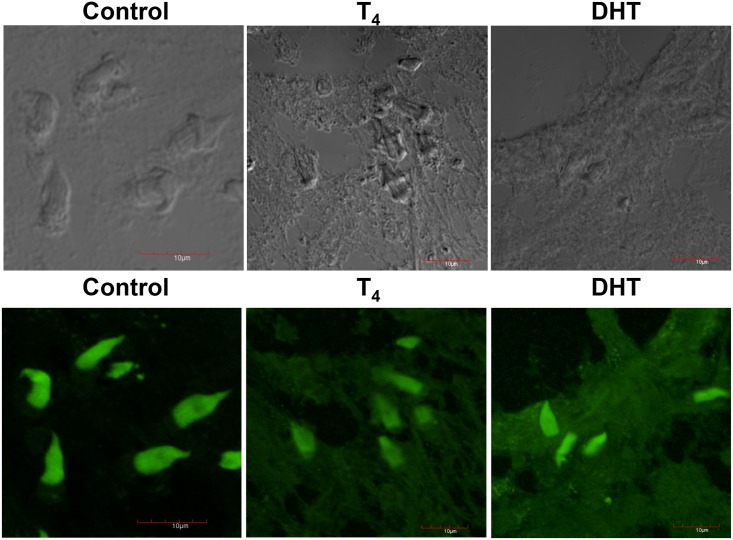
Fig 4. Immunolocalization of α-tubulin (green) of control, T4 and DHT treated parasites.
Phase contrast of the control sections of the slides obtained by Tissue-Teck fixing are shown in upper panel from left to right, control (C), testosterone (T4) and dihydrotestosterone (DHT). In lower panel, green tiny spots are produced by the specific binding of the anti-α-tubulin stained with alexa-488 antibody to cytoskeletal α-tubulin. Tubulin protein inside the bladder wall and at the level of the tegument in the tissue of control parasites and those treated with T4 and DHT. Scale bar corresponds to 10 μm.

