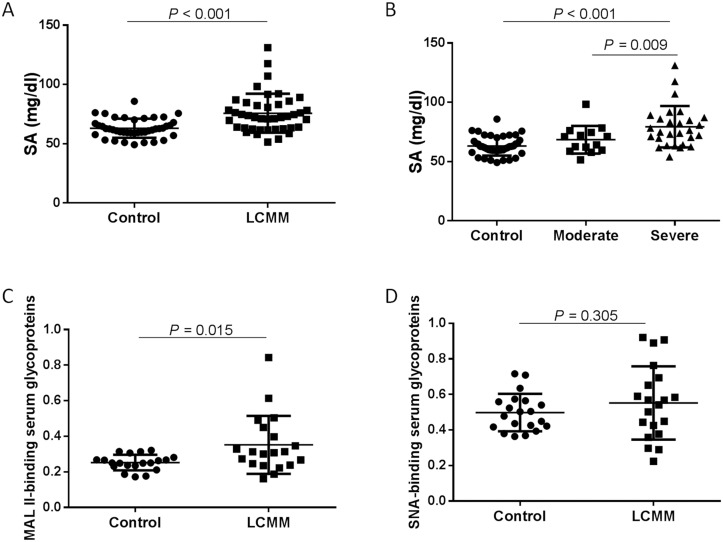
Fig 5. The levels of serum salic acid (SA) and sialylated glycoproteins.
The increased levels of serum salic acid (SA) and sialylated glycoproteins in LCMM patients were clarified by enzymatic method and using lectin blot, respectively. (A): The horizontal axis represents the experimental groups: control (n = 42), LCMM (n = 42). The vertical axis indicates the serum SA level (mg/dl), and error bars are mean ± standard deviations. (B) and (C): Lectin blots of serum glycoproteins were probed with MAL II and SNA representing the α-2,3-linked and α-2,6-linked sialylated proteins. The horizontal axis represents the experimental groups: control (n = 20) and LCMM (n = 20). The vertical axis indicates the fluorescence intensity ratio of MAL II or SNA binding proteins to total proteins stained by coomassie blue (CBB), and error bars are mean ± standard deviations. MAL II binding α-2,3-linked sialylated protein increased in LCMM patients, whereas there was no significant change in SNA binding α-2,6-linked sialylated proteins between LCMM patients and controls.

