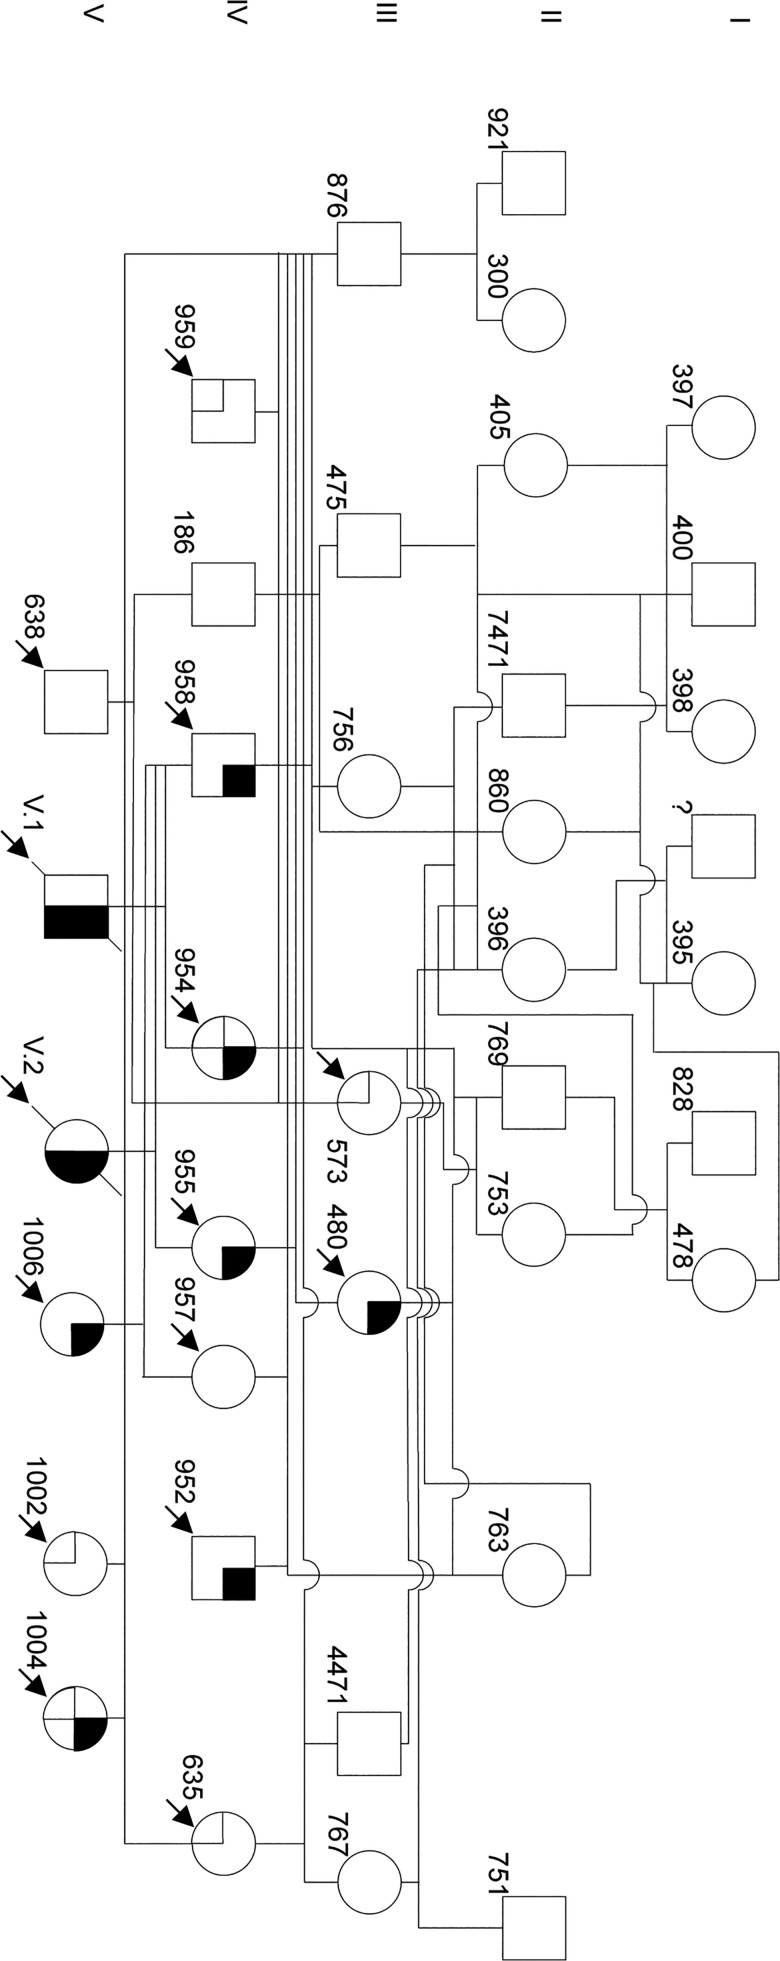
Fig 3. Pedigree analysis of the affected Galloway cattle family.
The graph shows the 5 generation pedigree of the tibial hemimelia affected Galloway cattle. Pedigree symbols are according to the standardized human pedigree nomenclature [58]. Numbers at the lower left of the symbols refer to the 3 or 4 last digits of the individual ear tag numbers. The affected calves (V.1, V.2) did not receive an ear tag number due to stillbirth. Arrows indicate samples that were provided for analysis. Symbol segments indicate the presence of the exon 2 (black) and exon 4 (cross hatched) duplications. The pedigree was drawn using Microsoft PowerPoint for Mac 2011 Version 14.4.8 (150116).

