Table 3.
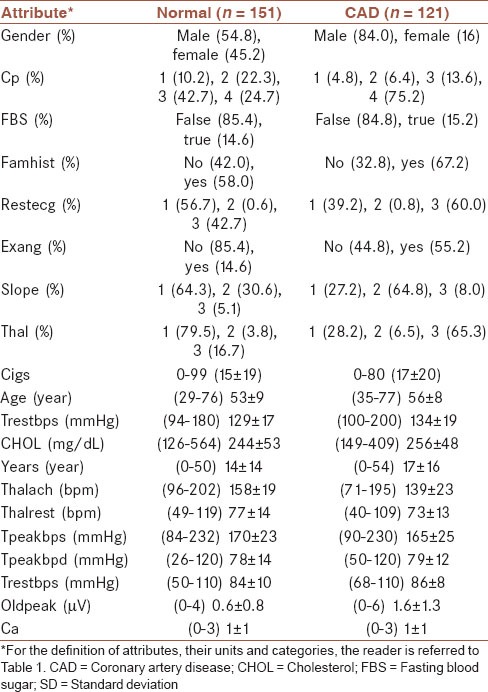
The attributes of the raw Cleveland dataset for normal and CAD groups, along with their categories (percentage) for nominal/ordinal variables and (minimum-maximum) mean ± SD for interval variables

The attributes of the raw Cleveland dataset for normal and CAD groups, along with their categories (percentage) for nominal/ordinal variables and (minimum-maximum) mean ± SD for interval variables
