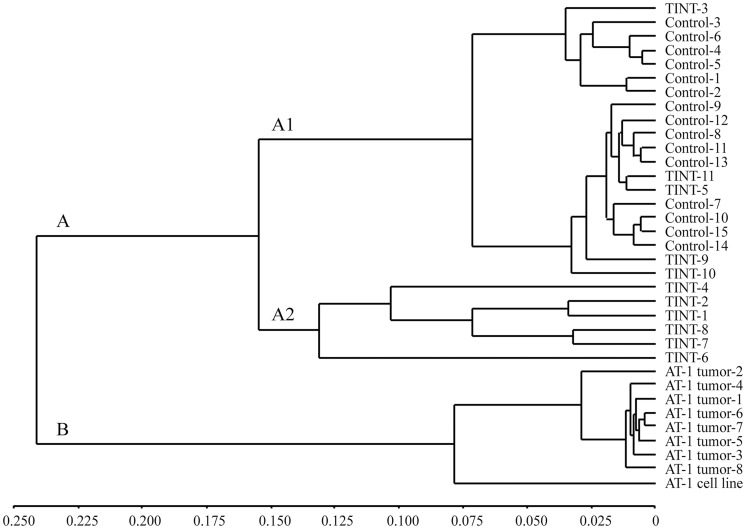
Fig 1. Unsupervised hierarchical clustering of samples based on the genome-wide expression profiles.
Control-, TINT-, tumor samples, and the AT-1 cell line were clustered based on the entire microarray dataset. The dendogram shows two major groups; A) containing TINT- and normal prostate tissue samples, and B) containing all AT-1 tumor tissue samples and the AT-1 cell line. TINT: tumor-adjacent normal prostate tissue.

