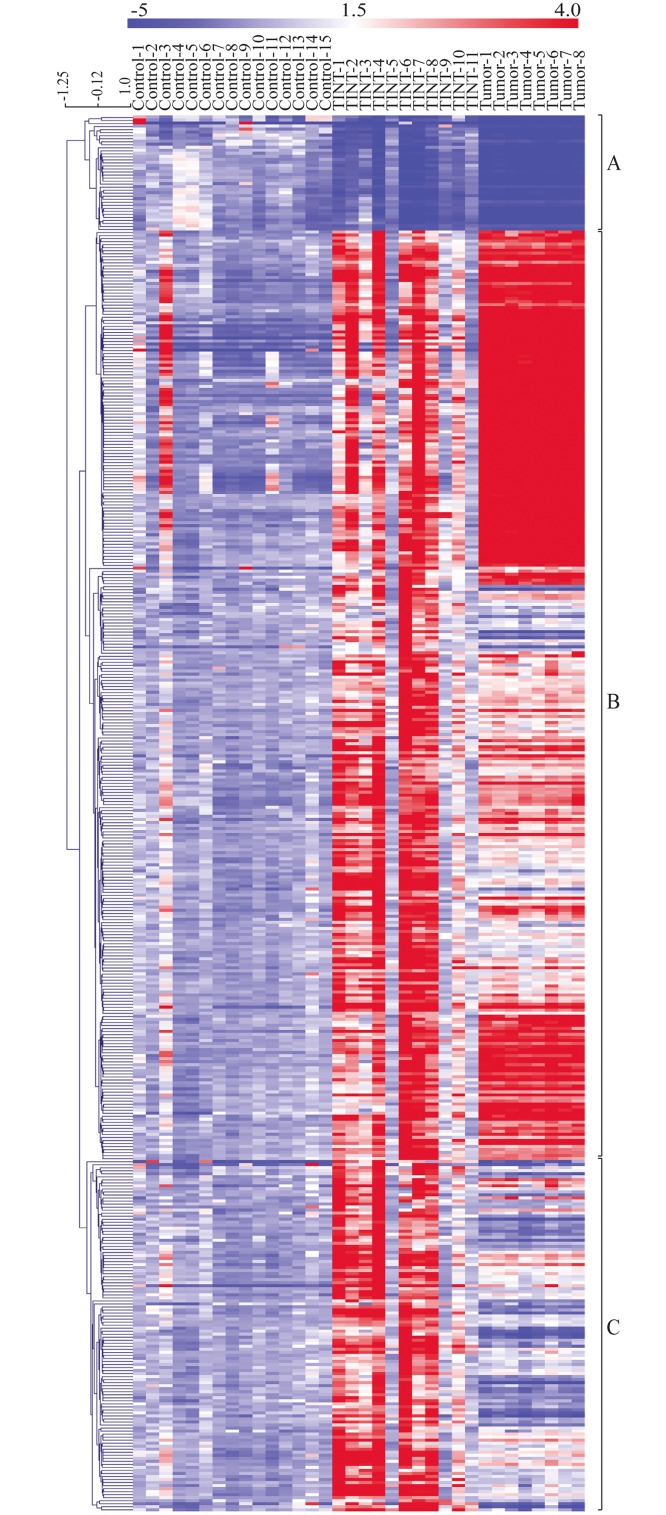
Fig 3. Heatmap showing the relative expression levels of genes differentially expressed between TINT and controls.
The rows represent expression levels for each of the 461 genes that were differentially expressed between TINT and normal prostate control tissue and the columns represent the signature of each sample (normal, TINT and tumor). Red color illustrates higher expression than the mean expression in normal prostate tissue and blue illustrates lower expression. Genes were hierarchical clustered using average linkage clustering with a pearson correlation. Three major gene clusters were identified: A) genes down-regulated in TINT and tumour vs. normal tissue, B) genes mainly up-regulated in both TINT and tumor tissue vs. normal tissue and C) genes exclusively up-regulated in TINT vs. normal control tissue. TINT: tumor-adjacent normal prostate tissue.

