
Figure 4.
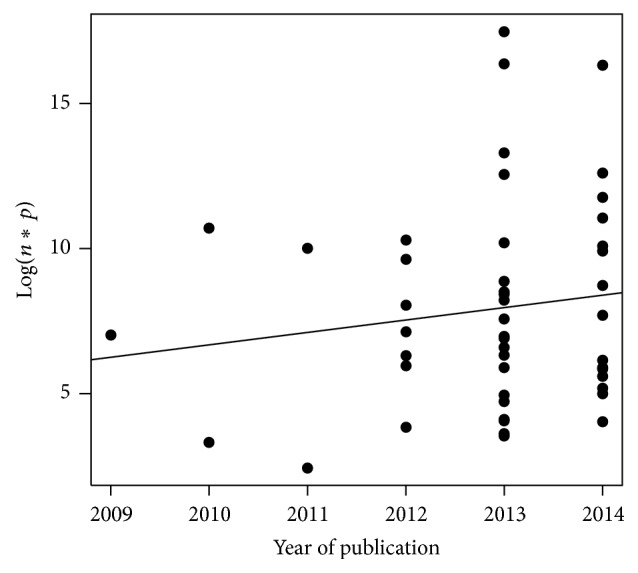
Log(n∗p) per year of publication. The continuous line represents the linear regression (P = 0.34).
Official websites use .gov
A
.gov website belongs to an official
government organization in the United States.
Secure .gov websites use HTTPS
A lock (
) or https:// means you've safely
connected to the .gov website. Share sensitive
information only on official, secure websites.
Log(n∗p) per year of publication. The continuous line represents the linear regression (P = 0.34).