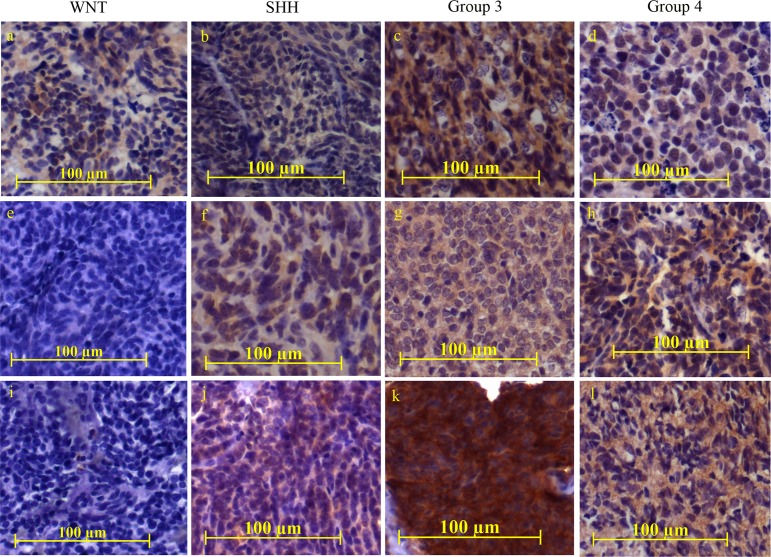
Figure 6. Immunohistochemical analysis of NRP1 expression in medulloblastoma tumor tissues.
NRP1 expression was studied in FFPE tissue sections belonging to the four molecular subgroups (WNT, SHH, Group 3, Group 4). The staining was scored as ‘negative’ for complete absence of staining, ‘Low’ for weak intensity and focal positive (~10-20% cells positive) areas, ‘Moderate’ for moderate intensity and more than or equal to 50% positive area while, ‘High’ for high intense staining in more than 80% of area. Representative images of NRP1 staining in the medulloblastoma tissues scored as negative (e, i), low (a, b, d, f, h), moderate (c, g, j, l) and high intense staining (k) respectively.

