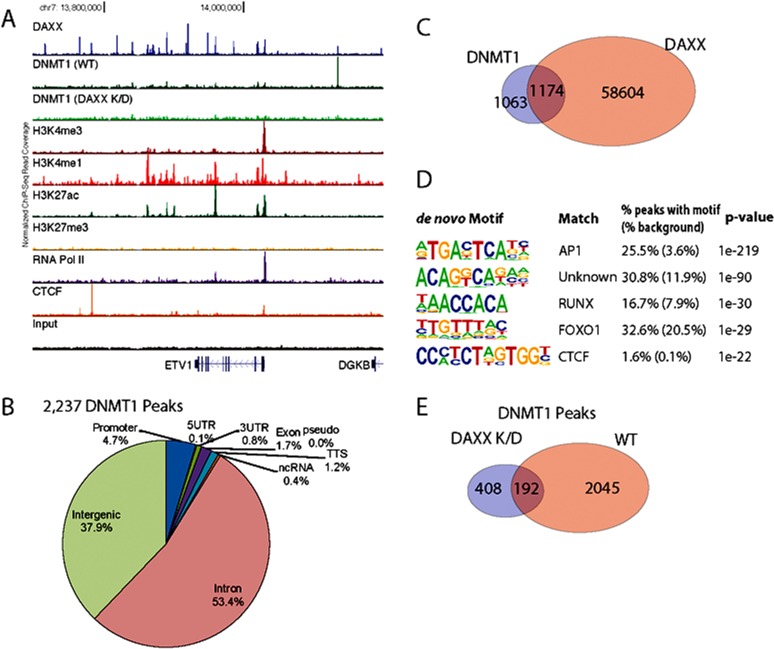
Figure 2. DAXX and DNMT1 ChIP-Seq's reveal that DAXX peaks overlap with DNMT1 peaks.
A. ChIP-Seq binding profile of DAXX, DNMT1, and epigenetic markers in PC3 cells at the ETV1 locus. DNMT1 binding is shown for both WT and DAXX K/D conditions B. Annotation of 2,237 DNMT1 ChIP-Seq peaks relative to RefSeq transcript annotations. C. Overlap between DAXX and DNMT1 peaks. Significance of overlap p-value < 10−100 (binomial test, relative to random genomic distribution). D. Results of de novo motif enrichment on DAXX ChIP-Seq peaks using HOMER. E. Overlap between DNMT1 peaks found in PC3 WT cells and PC3 DAXX K/D cells.

