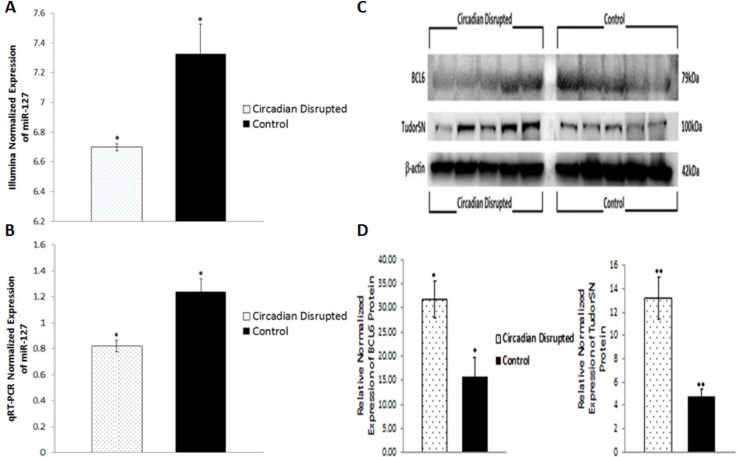
Figure 6. Circadian disruption causes decreased expression of miR-127, and increased expression of Tudor-SN and BCL6.
A. Mean relative expression of miR-127 based on Illumina sequencing, *p-adjusted < 0.1, N = 6. B. Mean Relative expression of miR-127 based on qRT-PCR data, *p < 0.05, N = 10. C. Western immunoblotting images of BCL6, Tudor-SN, and β-actin from a 10% SDS-PAGE gel for the 2-week chronic ZT06 group. Images were taken with the FluorChem HD2. The five samples on the left represent the circadian disrupted samples, and the five samples on the right represent the control samples. D. Mean relative expression of the BCL6 and Tudor-SN proteins based on the actin band in C,*P < 0.05, N =10.

