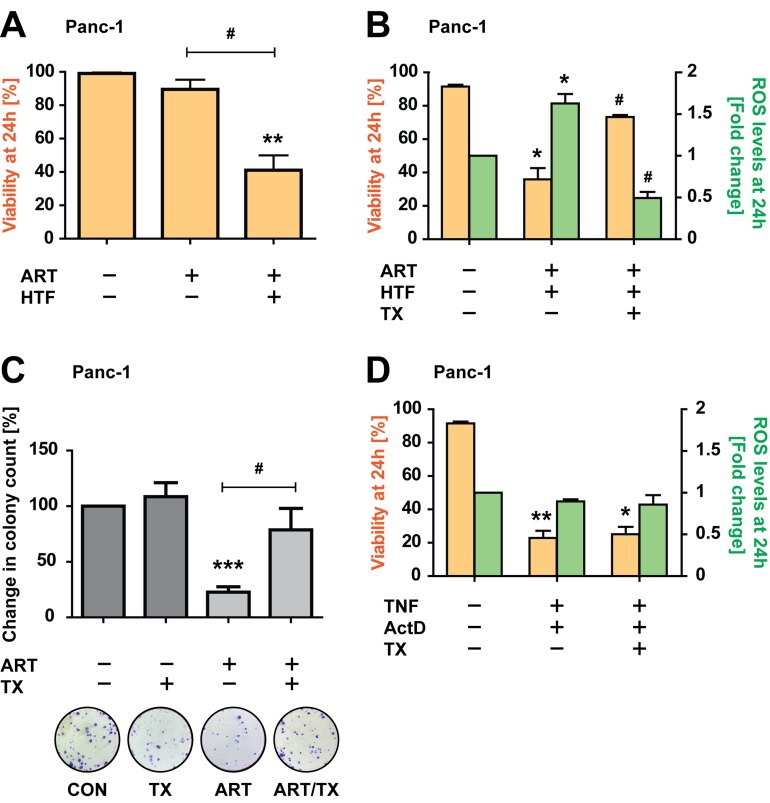
Figure 2. ART-induced, HTF-potentiated PDAC cell death is ROS-dependent.
A. Panc-1 cells were exposed to ART alone or in combination with HTF. At 24 hours cells were stained with PI and analyzed by imaging-coupled flow cytometry. The percentages of PI-negative cells are presented, as an index of viability. Statistical significance was tested vs. control (*) or ART alone (#) (n = 5; #, p ≤ 0.05; **, p ≤ 0.005). B. Panc-1 cells were treated with ART and HTF, without and with addition of the antioxidant trolox (TX, 0.5 mM). At 24 hours, cell were stained with H2DCFDA and PI and analyzed by imaging-coupled flow cytometry. The percentage of PI-negative cells (viability) is shown (yellow bars). The mean DCF intensities of viable cells are presented normalized to control conditions (green bars). Statistical significance was tested vs. control (*) or ART alone (#) (n = 3; *,#, p ≤ 0.05). C. Colony formation assays were performed for cells exposed for 24 hours to ART or TX alone, or in combination. Colony count at 11 days post treatments is presented as fold change compared to control conditions. Statistical significance was tested vs. control (*) or ART alone (#) (n = 6; #, p ≤ 0.05; ***, p ≤ 0.001). D. Panc-1 cells were exposed to TNF (43 ng/ml) and ActD (1 μg/ml), without and with TX. At 24 hours, cell were stained with H DCFDA and PI and analyzed by imaging-coupled flow cytometry. The percentage of PI negative cells (viability), and mean DCF intensities of viable cells, normalized to control conditions, are presented. Statistical significance was tested vs. control (n = 3; *,#, p ≤ 0.05; **, p ≤ 0.005).

