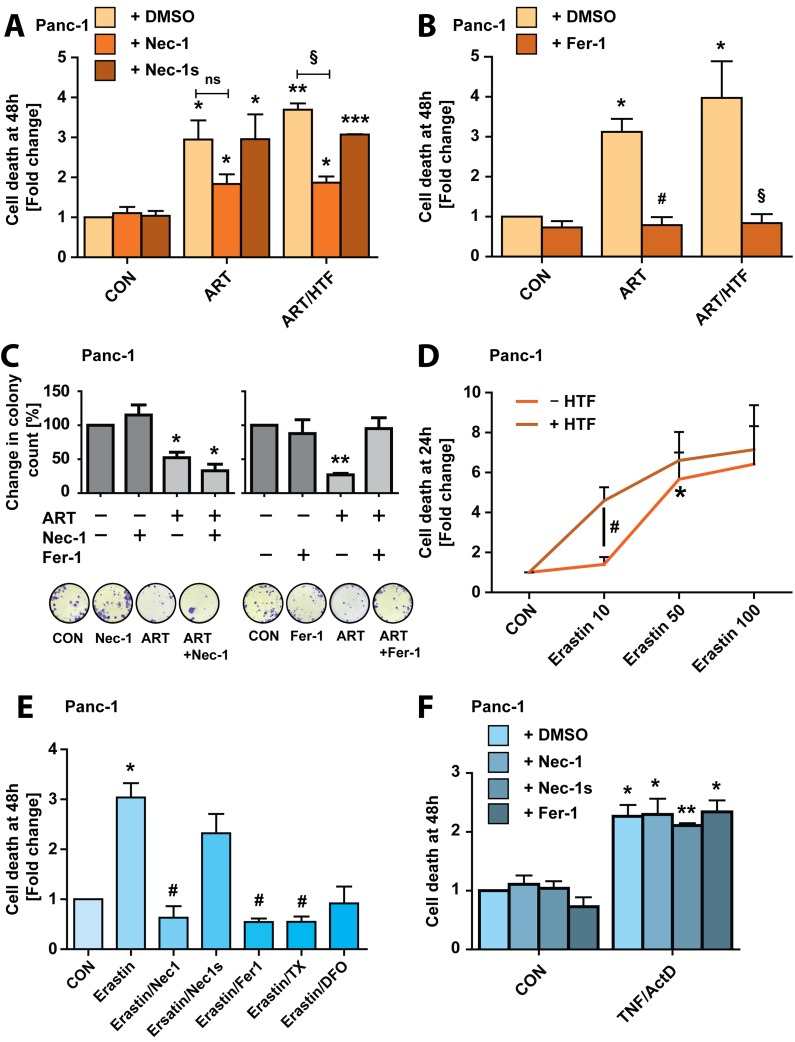
Figure 4. ART induces ferroptosis in Panc-1 cancer cells.
A. Panc-1 cells were subjected to ART or ART/HTF with and without addition of Nec-1 (20 μM) or Nec-1s (20 μM) for 48 hours. Following, cells were stained with Yo-Pro-1 and analyzed using a fluorescence plate reader. Cell death is presented as fold change increase in Yo-Pro-1 intensity normalized to DMSO control. Statistical significance was tested vs. control (*), ART (#), or ART/HTF treatment (§) (n = 3; *,#,§, p ≤ 0.05; **, p ≤ 0.005, ***, p ≤ 0.001). B. Panc-1 cells were treated with ART or ART/HTF without or with Fer-1 (20 μM) for 48 hours. Cell death was measured by Yo-Pro-1 fluorescence detection and is presented as fold change increase in Yo-Pro-1 intensity normalized to DMSO control. Statistical significance was tested vs. control (*), ART (#), or ART/HTF treatment (§) (n = 3; *,#,§, p ≤ 0.05). C. Colony formation assays were performed with Panc-1 cells subjected to Nec-1, Fer-1, or ART alone or ART in combination with Nec-1 or Fer-1. Colony count at 11 days post treatment is presented as fold change compared to control conditions. Statistical significance was tested vs. control (*) or ART treatment (#) (n = 3; *,#, p ≤ 0.05; ** p ≤ 0.005). D. Panc-1 cells were subjected to erastin (10-100 μM) without and with HTF for 24 hours. Cell death was measured by Yo-Pro-1 fluorescence detection and is presented as fold change increase in Yo-Pro-1 intensity normalized to control conditions. Statistical significance was tested vs. control (*), or 10 μM erastin (#) treatment (n = 3; *,#, p ≤ 0.05). E. Panc-1 cells were subjected to erastin (50 μM) alone or in combination with Nec-1, Nec-1s, Fer-1, TX, or DFO for 48 hours. Cell death was measured using Yo-Pro-1 and is presented as fold change in Yo-Pro-1 fluorescence intensity normalized to control conditions. Statistical significance was tested vs. control (*), or 50 μM erastin (#) treatment (n = 3; *,#, p ≤ 0.05). F. Panc-1 cells were subjected to TNF/ActD without or with Nec-1, Nec-1s, or Fer-1 for 48 hours. Cell death was measured with Yo-Pro-1 and is presented as fold change in Yo-Pro-1 fluorescence intensity normalized to control conditions. Statistical significance was tested vs. control treatment (n = 3; *, p ≤ 0.05; **, p ≤ 0.005).

