Figure 3.

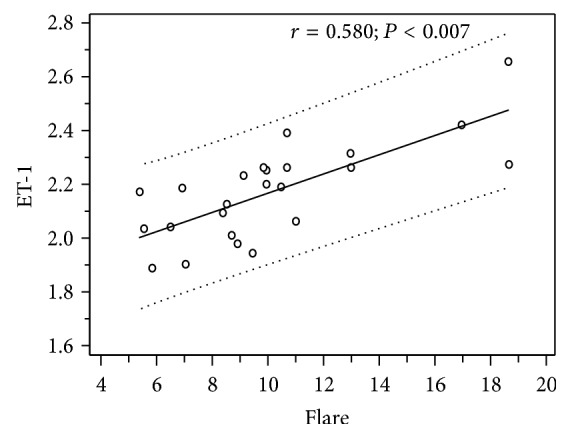
Scatterplot showing the correlation between ET-1 plasma levels (picogram/milliliter) and aqueous flare (photon counts/millisecond) in patients with retinitis pigmentosa.

Scatterplot showing the correlation between ET-1 plasma levels (picogram/milliliter) and aqueous flare (photon counts/millisecond) in patients with retinitis pigmentosa.