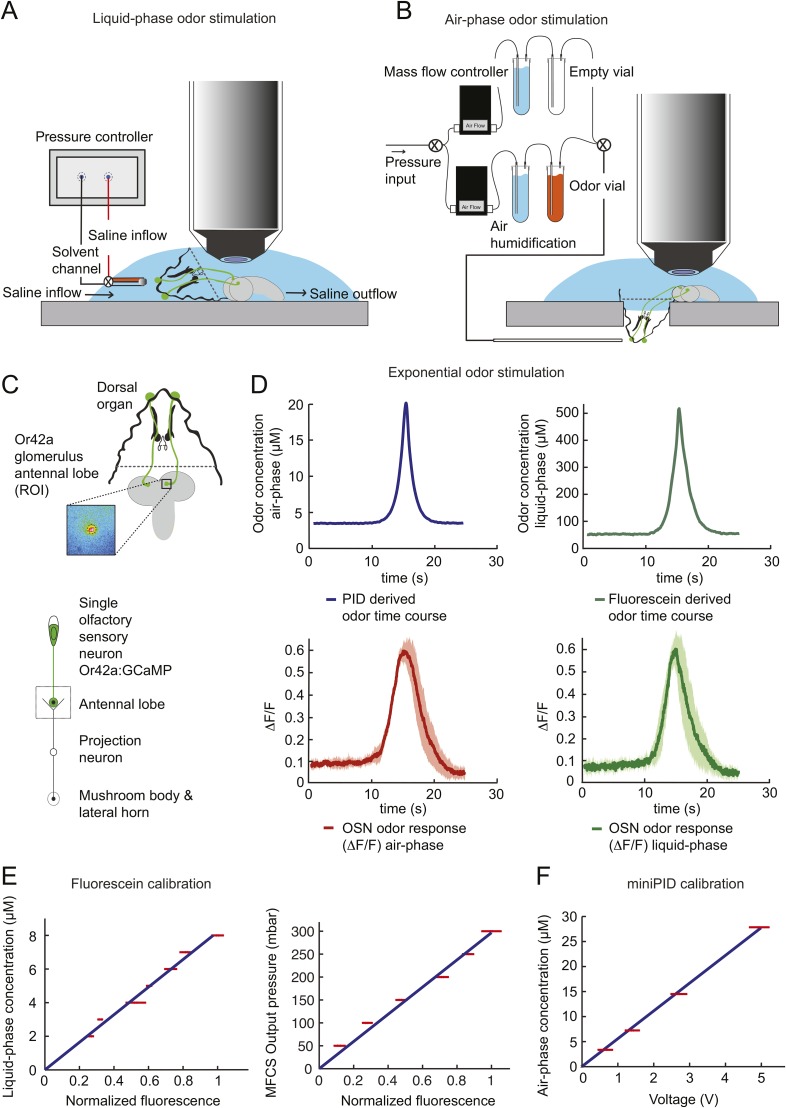
Figure 12. Phase conversion of air and liquid phase odor stimulation.
(A) Schematic illustration of the single-OSN imaging setup: liquid phase odor stimulation of the larval dorsal organ with a pressure controller connected to a two-barrel pipette. The odor solution is placed in one channel of a two-barrel pipette while the other channel contains pure saline. The fixed larval head is perfused by a constant flow of extracellular saline while the odorous solution is delivered via the glass pipette. As for the olfactometer in gaseous phase (panel B), rapid changes in concentration of the odorous stream are achieved by varying the flow of the empty channel and the odorous channel while keeping the overall flow constant. As described in ‘Materials and methods’, the flow rates of individual channels are controlled by a system of mass flow controllers. (B) Air-phase odor stimulation of the larval dorsal organ with a custom-built olfactometer. A continuous stream of air (510 ml/min) is regulated by combining the outputs of two mass flow controllers. The air stream is humidified, and subsequently passed through the odor solution after which the odorous air stream is delivered to the larval dorsal organ. Rapid concentration changes of the odorous stream are achieved by varying the flow between the empty channel and the odor channel while keeping the overall flow constant. As described in the ‘Materials and methods’, individual flow rates are controlled in real-time. The OSN activity was recorded by imaging the GCaMP activity elicited in the axon terminal of the Or42a OSN. (C) Schematic illustration of the site of imaging of single OSN glomeruli at the level of the antennal lobe (inset: false-color-coded activity in the axon terminal of the Or42a OSN). (D) Odor response profile (ΔF/F) of the Or42a OSN in response to an exponential odor stimulation in the air-phase (left) and liquid-phase (right). The response amplitude and overall dynamics are conserved between the liquid and gaseous phases. Shades denote standard deviation. Recordings were made on a total of six experiments conducted on three different preparations. (E) Calibration of fluorescein in liquid phase showing a linear relationship of the fluorescein concentration and the measured change in fluorescence (left panel). Linear relationship between the observed change in fluorescence and the output pressure of the odorous stream (right panel). (F) Calibration of the photoionization detector (PID) with airborne odorant stimuli showing a linear relationship between the odor concentration and the measured voltage change. Error bars denote standard deviation.

