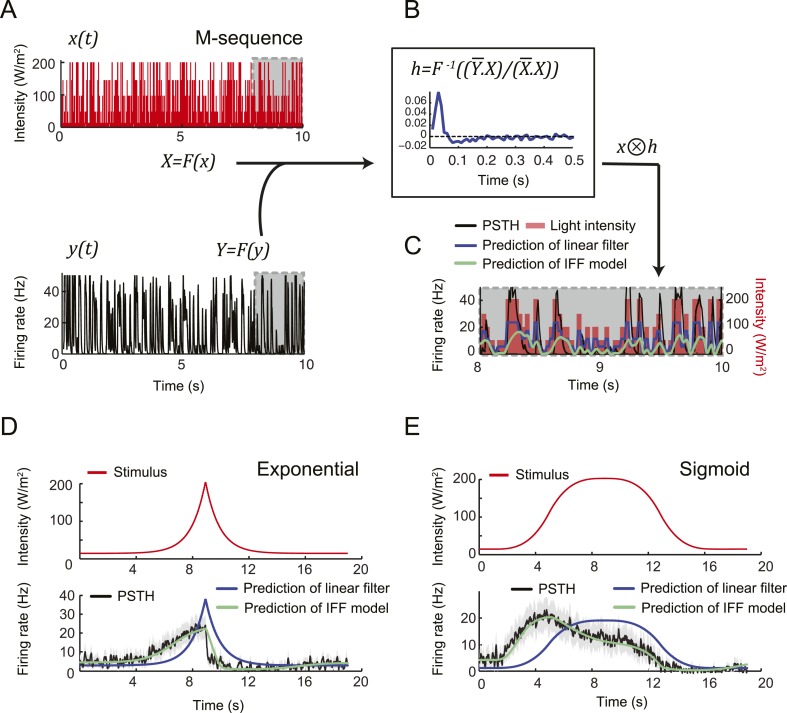
Figure 13. A linear filter alone is insufficient to account for the transfer function of the Or42a>ChR2 OSN.
(A) Stimulation of the Or42a>ChR2 OSN by a maximum-length (M) sequence generated with light. The M-sequence was based on a discretization of the light intensity range 15–207 W/m2 into the following 5 values: 15, 50, 100, 150, and 207 W/m2. The M-sequence featured all possible 4-element combinations of these 5 intensities. In the experiments, changes in light intensity occurred with time steps of 33 ms. (Bottom, left) PSTH of the neural response computed over 10 trials (10 preparations) and for a bin size of 10 ms. The gray boxes outline a 2-s time window over which the predictions of the linear filter are reported in panel C. (B) Computation of the linear filter, h, through the operations described in panel B (Chichilnisky, 2001; Nagel and Wilson, 2011). Function F represents the Fourier transform from the time domain to the frequency domain; F−1 represents the inverse transformation from the frequency domain to the time domain. The bar above the variables in frequency space denotes the complex conjugate transformation. To cancel any DC drifts in the OSN response, the filter was computed on windows of 5-s slid over the entire duration of stimulus (20 s). An average filter was computed from this series (dark blue line). The linear filter was used to make predictions about particular stimulus time courses. (C) Neural activity predicted from the linear filter in response to the M-sequence. The prediction was obtained by convolving the filter with the time course of the stimulus. The resulting activity was normalized to have the same mean as the experimental activity. The result of the prediction is shown for a 2-s window of the complete stimulus (dashed gray box in panel A). The activity predicted from the linear filter (dark blue line) is compared to the output of the IFF (ODE) model introduced in Figure 4B (green line). Pearson's correlation coefficient (ρ) of the predicted and the experimental activities is 0.37 for the linear filter reconstruction compared to 0.57 for the IFF model. (D) Application of the linear filter derived in panel C for the M-sequence to stimulation by an exponential ramp (red line). The linear filter (dark blue line) fails to predict the PSTH that was observed experimentally (black line; gray error bars represent the standard deviation) (ρ = 0.56). Prediction of the IFF model shown in green (ρ = 0.93). (E) Application of the linear filter derived in panel C to a sigmoid ramp (red line). As in panel D, the linear filter (dark blue line) fails to reproduce the experimental PSTH (ρ = 0.54) while the IFF model leads to a good fit (green line, ρ = 0.98).

