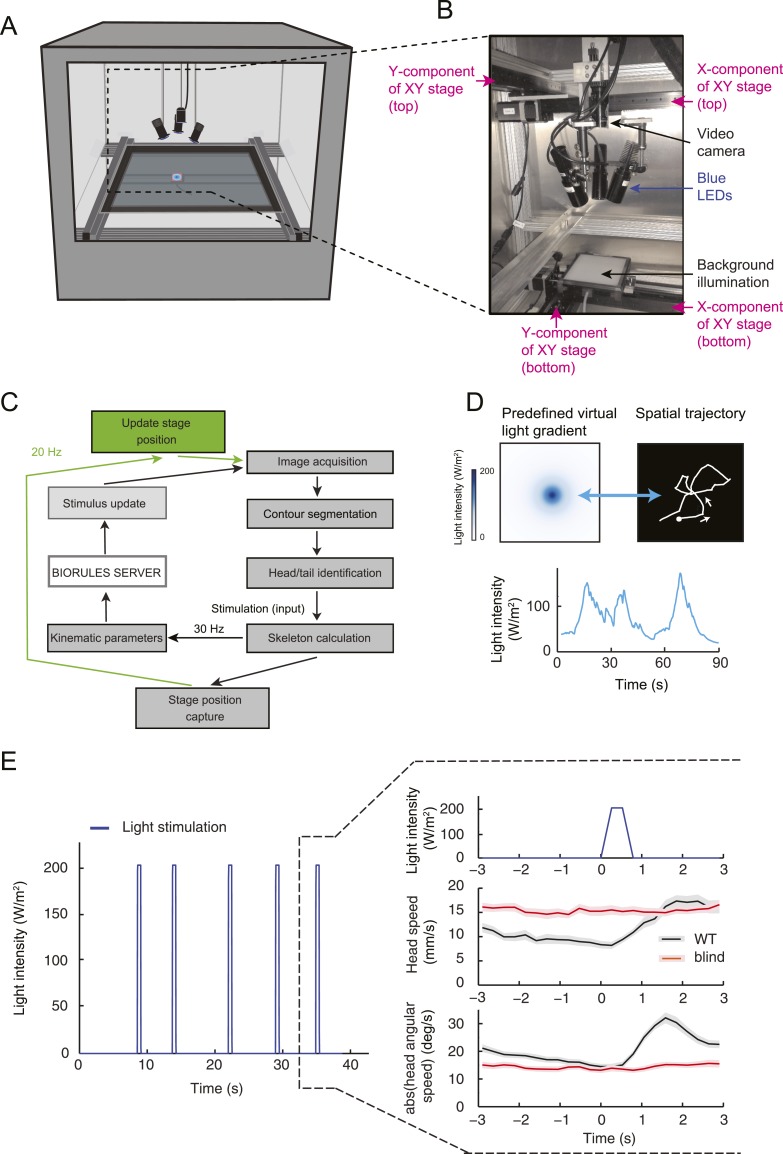
Figure 15. Technical description of the closed-loop tracker for virtual olfactory realities.
(A) Schematic drawing of the closed-loop tracker. The blue LEDs and the camera are mounted on a moving stage that follows the larva while it crawls on an agarose slab (40 × 40 cm or approximately 120 × 120 body lengths of the larva). (B) Depiction and description of the moving camera stage equipped with three LEDs. (C) Flow chart outlining the interaction of the core modules of the tracking software (‘Materials and methods’). (D) Illustration of the spatial trajectory generated by an Or42a>ChR2 larva undergoing closed-loop light stimulation in a virtual odor gradient. (Top-left) Predefined light landscape with a geometry approximating the odor distribution produced by a point source. During the behavioral tests, the full gradient is not projected onto the arena: the larva is illuminated by the LEDs at an intensity determined by its position in the virtual light gradient. (Bottom) The light intensity is updated based on the motion of the larva, which forms the temporal evolution shown in the graph. (Top-right) The spatial trajectory described by an Or42a>ChR2 larva in the virtual light gradient. The orientation response faithfully reproduces chemotactic behavior. In closed-loop experiments, the LED intensity was updated according to the position of the head with respect to a predefined spatial landscape. In open-loop experiments, the LED intensity was determined by a predefined temporal profile implemented only when a larva was in a run mode (Figure 5B). During a run, the motion of the larva had no influence on the intensity of the stimulus. As soon as the larva interrupted a run, the light intensity returned to a baseline value (15 W/m2). (E) Abolishment of photophobic behavior in blind larvae. Stimulation of larvae with light flashes of 0.5 s (intensity: 207 W/m2). The flashes were interspaced by a time interval picked from a Poisson distribution with mean 7.7 s. To ensure that a larva had sufficient time to react to individual light pulses, the minimum inter-flash interval was set to 5 s. The behavior resulting from the flash was characterized by computing the flash-triggered averages of the amplitude of the absolute head angle and its time derivative. Wild-type larvae (black trace) display an increase in head motion following the flash (release of head cast). Blind GMR-hid;dTrpA11 larvae (red trace) were not affected by the light flashes. The graph represents the means of the kinematic variables computed across trajectories; error bars denote SEM.

