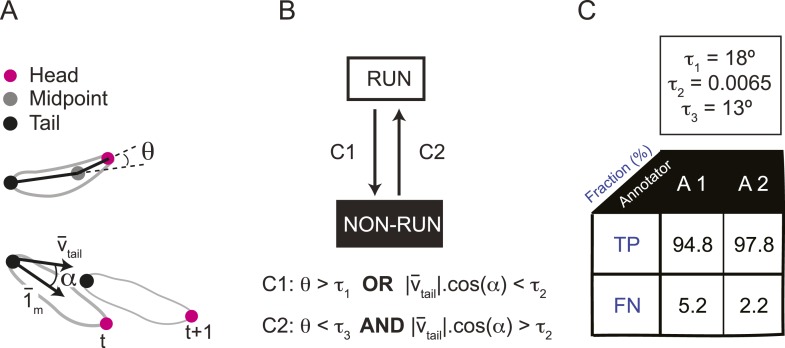
Figure 16. Real-time classification of the locomotor behavior of the larva.
(A) In the present study, the locomotor behavior of the larva is classified into two basic types of action: forward runs and non-runs. Non-run is a meta-state that includes stops, turns, casts, and backward runs. No distinction is made between non-run behaviors. To distinguish runs from non-runs, we defined empirical filters based on the following three sensorimotor features: (1) the head angle between the direction of the body axis (tail-midpoint) and the neck axis (head-midpoint); (2) the instantaneous velocity vector measured at the tail position (vector vtail) and (3) the angle α formed by tail velocity vector and the direction of the body axis (unitary vector 1m). (B) Transitions from a run to a non-run state take place as soon as (i) the head angle is larger than a threshold τ1 or (ii) the dot product of the tail velocity vector and unitary vector corresponding to the direction of the body axis is smaller than τ2 (condition C1). The first condition on the head angle identifies head casts while the second condition on the dot product identifies sequences of behavior associated with a stop or a backward run. Transitions from a non-run to a run take place when the following two conditions are verified: (iii) the head angle must be lower than the threshold value τ3 and (iv) the dot product of the tail velocity and unitary vector along the body axis must be larger than τ2 (condition C2). (C) The thresholds of conditions (i–iv) were set at a value that maximizes the difference in the cumulative distribution of the run and non-run states along the relevant sensorimotor feature (head angle or dot product) for the two possible types of behavioral state transitions (run → non-run or non-run → run). Distributions of the frame-by-frame sensorimotor features were constructed by pooling the annotated frames from four representative trajectories. Manual annotation was achieved by two trained experimenters. (Top) The values of the thresholds used in the analysis were: τ1 = 18°, τ2 = 0.0065, and τ3 = 13°. (Bottom) Comparison of frame-by-frame manual classification of run/non-run behavior achieved by the two trained annotators (A1 and A2) vs the computational classification obtained by filters described in panel B. The table reports the percentage of true positives (frames classified as a run by both the annotator and the algorithm) and false negatives (frames classified as a run by the annotator and a non-run by the algorithm). This good match validates the use of the computational classifiers in real-time experiments.

