
Figure 1.
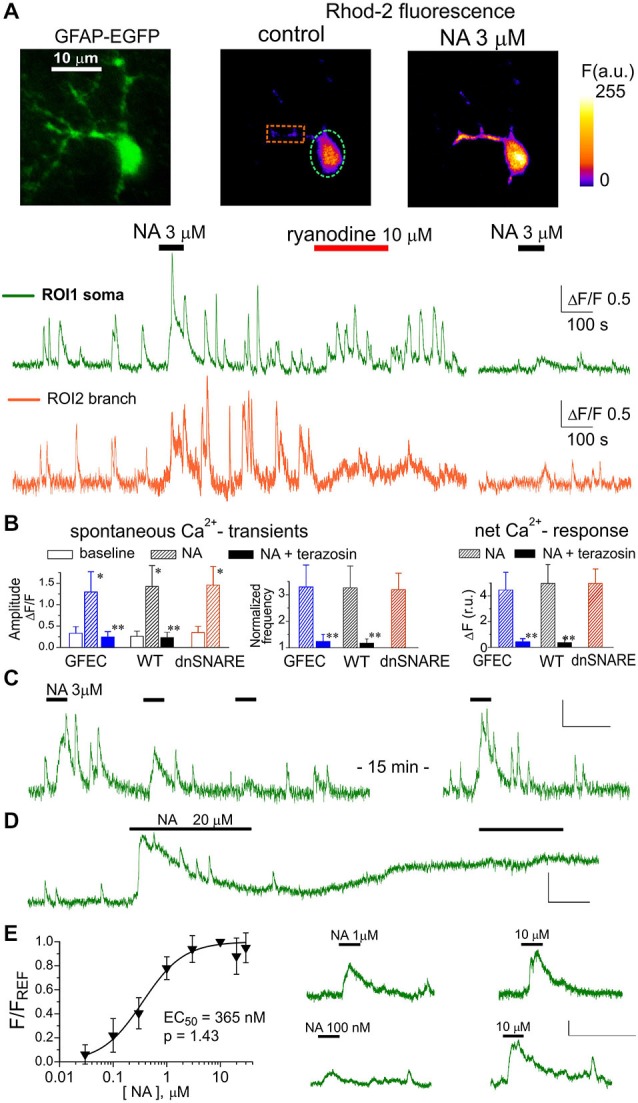
α1-adrenoreceptors contribute to Ca2+ signaling in cortical astrocytes. (A) Representative multi-photon images of enhanced green fluorescent protein (EGFP) fluorescence and presudo-color images of Rhod-2 fluorescence recorded in the astrocytes from glial fibrillary acidic protein (GFAP)-EGFP (GFEC) mouse before (control) and after the application of noradrenaline (NA). Graphs below show the time course of Rhod-2 fluorescence averaged over regions indicated in fluorescence images. Note the marked spontaneous elevations in the Ca2+ level, which were enhanced by application of NA. Note the significant NA-activated response in the astrocytic branch and inhibition of response to NA 10 min after application of ryanodine. (B) The pooled data on peak amplitude and frequency of spontaneous Ca2+-transients and the net response to the NA recorded in astrocytes of different mice strains in control and in the presence of α1-AR antagonist terazosin (30 nM). Frequency of spontaneous transients (middle graph) was measured within 3 min after application of NA and was normalized to baseline value. Net response was evaluated as an integral Ca2+-signal measured during 3 min after NA application, averaged over the whole cell image and normalized to the integral Ca2+ signal measured during 3 min before NA application. Data are shown as mean ± SD for seven cells in control (for each strain) and six cells under terazosin (WT and GFEC). In the each strain, asterisks (*) indicate statistical significance of effect of NA on the peak amplitude of Ca2+-transients in comparison to the corresponding baseline value, double asterisks (**) indicate significance of inhibitory effect of terazosin in comparison to the effect of NA alone; P < 0.01 given by t-test in both cases. (C) repetitive application of NA (3 μM) with 5 min interval causes the desensitization of the response; (D) prolonged application of 20 μM NA leads to the elevated Ca2+ level and non-responsiveness of neocortical astrocytes; (E) the concentration-dependence of net Ca2+-transients evoked by NA in cortical astrocytes was assessed as described in the Methods; each point show mean ± SD for 4–5 cells. Fluorescent signals shown in panels (C–E) were integrated over the cell somata; all scale bars are ΔF 0.5 and 200 s.