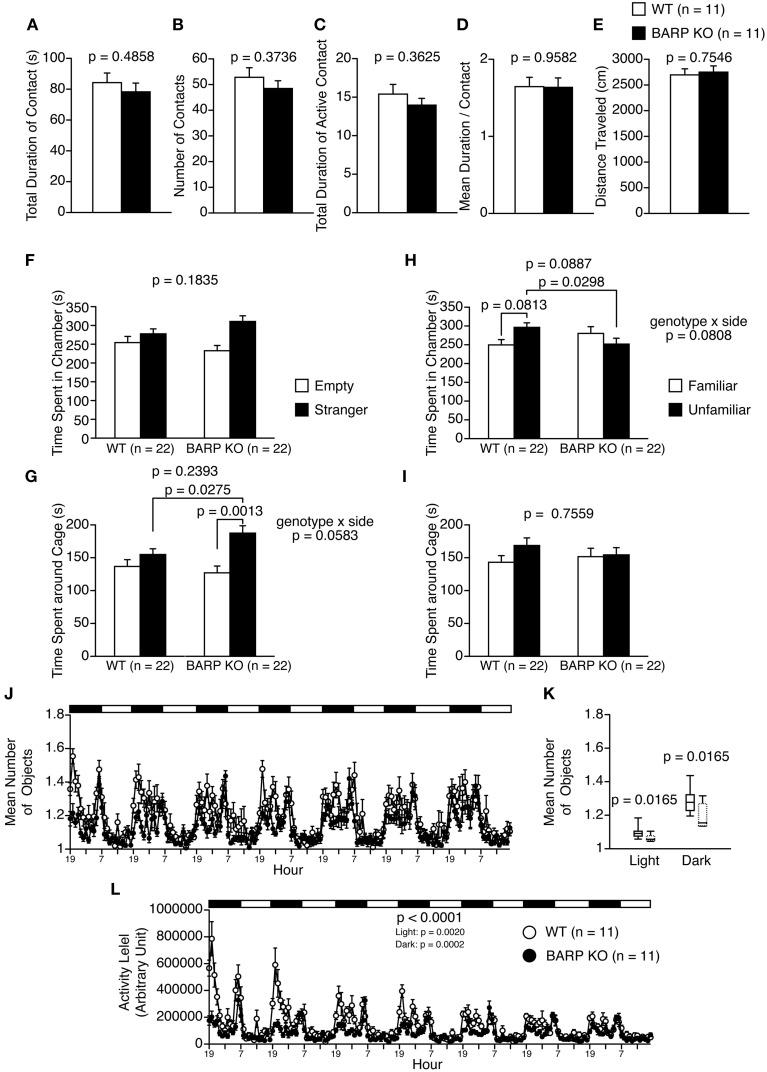
Figure 4.
Nominally significant increase in sociability in beta-anchoring and -regulatory protein (BARP) knockout (KO) mice. (A–E) Social interaction test: the total duration of contacts (A), number of contacts (B), total duration of active contacts (C), mean duration of each contact (D), and total distance traveled (E) are shown. (F–I) Sociability test (F,G) and social novelty preference test (H,I): the time spent in chamber in the sociability test (F), time spent around cage in the sociability test (G), time spent in chamber in the social novelty preference test (H), and time spent around cage in the sociability test (I). In the sociability test, the time spent in the chamber with the empty cage (empty side) and with the cage containing a stranger (stranger side) are shown, and the time spent in the vicinity of the empty cage (empty side) vs. the cage containing a stranger (stranger side) are shown. In the preference for social novelty test, the time spent in the chamber with the cage containing a stranger (unfamiliar side) and with the cage containing a familiar (familiar side) are shown, and the time spent in the vicinity of the cage containing a stranger (unfamiliar side) and the cage containing a familiar (familiar side) are shown. (J–L) 24-h home cage social interaction test: mean number of objects detected (J), box plot distributions of mean number of objects detected (WT, solid line; BARP KO, dashed line) (K), and activity level (L) over 7 days. Data are shown as mean ± SEM or in box plots (median, interquartile, and 90 and 10th percentiles). The p-values indicate the genotype effect in a t-test (A–I), a Mann–Whitney U-test (K) and a Two-Way repeated measures ANOVA (L).

