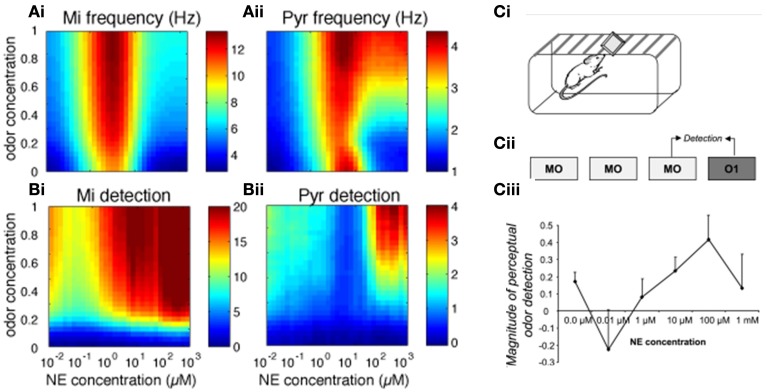
Figure 2.
Bulbar and cortical NE modulate odor detection. The graphs show how different levels of NE modulation affect firing rates and detection for a range of odor concentrations. The colormaps show 30 × 30 grid of firing rate and detection values as a function of NE levels (x-axis) and odor concentration (y-axis), with warmer colors representing higher amplitudes. (A) Mi and Pyr firing rates; (B) Mi and Pyr odor detection. (C) Related behavioral results, reprinted from Linster et al. (2011). (Ci, Cii) Spontaneous odor detection task. Rats were presented with mineral oil or odors diluted in mineral oil placed on a weighing dish on the lid of the home-cage and investigation times were recorded (Ci). Three presentations of mineral oil (MO) were followed by one presentation of an odorant (O1) diluted to approximate vapor partial pressure of 10−6 Pa (Cii). The graph on (Ciii) shows the magnitude of perceptual detection as a function of dosage of NE infusions into the OB. The magnitude of detection was calculated as the difference between the response to the last MO trial and the odor (O1) trial divided by their sum.

