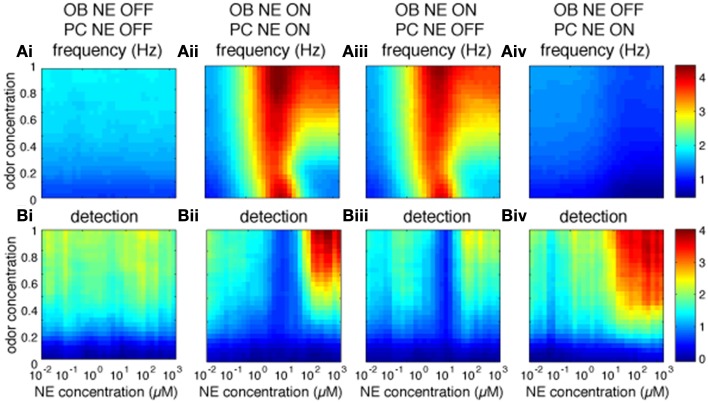
Figure 5.
Role of bulbar and cortical NE for odor detection. The graphs show how different levels of NE modulation in OB and PC separately affect PC firing rates and detection for a range of odor concentrations. The colormaps show 30 × 30 grid of firing rate (A) and detection values (B) in PC pyramidal cells as a function of NE levels (x-axis) and odor concentration (y-axis), with warmer colors representing higher amplitudes. (Ai,Bi) show Pyr firing rates and detection when NE modulation is OFF in both OB and PC. (Aii,Bii) show control simulations with NE modulation ON in both OB and PC. (Aiii,Biii) show results for NE modulation ON in OB only and (Aiv,Biv) for NE modulation ON in PC only. Blocking NE in both OB and PC has a significant effect on firing rates as compared to control (P < 0.001, using Wilcoxon signed rank test; as has blockade of OB or PC NE (P < 0.001). In contrast, blocking NE in PC only has no significant effect on firing rates (P = 0.46), suggesting that cortical NE modulation plays a small role in our simulations.

