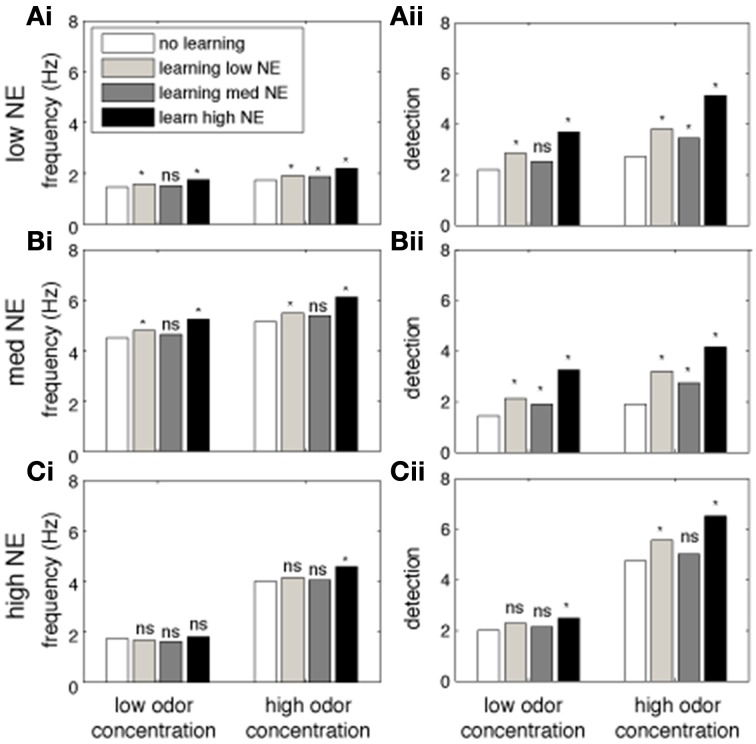
Figure 6.
The impact of NE on cortical learning. The graphs show the effects of training the Pyr network at different levels of NE modulation on recall of the trained odor. Each bar shows the average measurement over 40 tests using randomly chosen odorants. The white bars show tests where no learning (training) was performed. Light gray bars show responses after learning with low NE (10−2 μM). Dark gray bars show recall after learning with medium NE (1 μM) and black bars used high (1 M) levels of NE. Bars on the left show recall of low concentration (c = 0.2) odorants, on the right of high concentration (c = 0.8) odorants. Recall under low (10−2 uM), medium (1 uM) and high (1M) concentrations of NE is shown in (A–C), respectively. The PC network was first trained on a randomly chosen odor for 4 consecutive 5 s training sessions; the same odorant is then presented during the recall step and average firing rates and detection are calculated. Recall responses are compared to initial responses with no training (*indicates p < 0.001; student t-test).

