Figure 4.
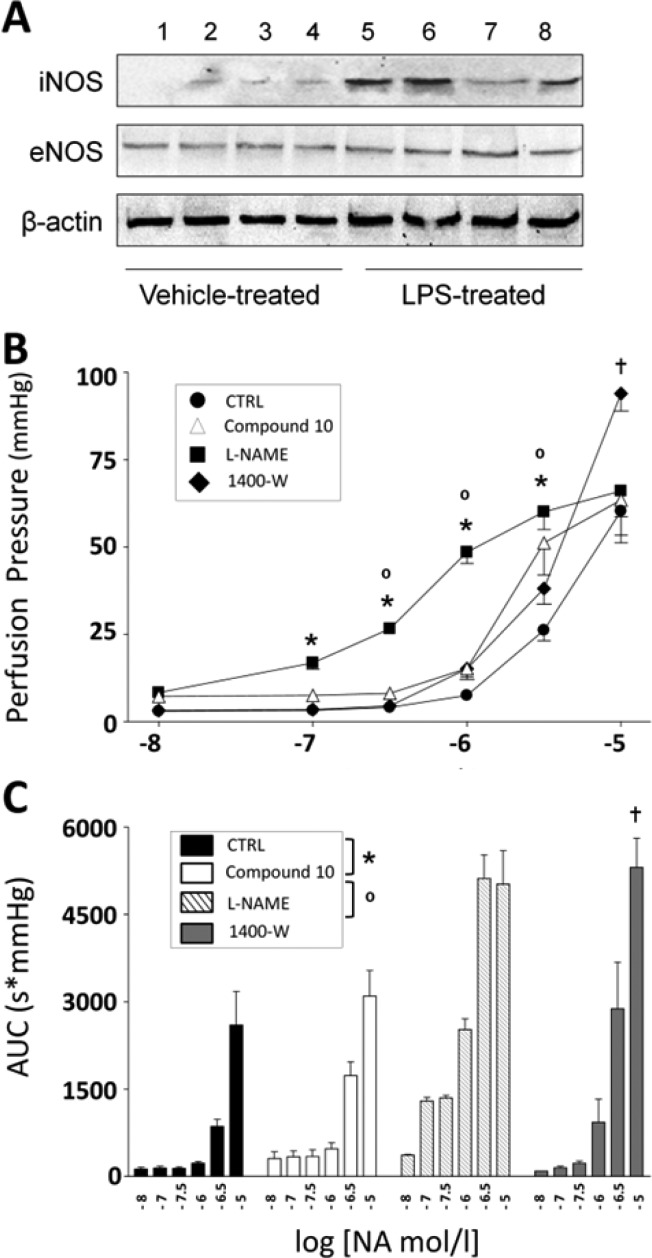
Effects of compound 10 on NA-induced vasoconstriction. (A) Aortas were isolated from SD rats injected with vehicle or LPS. Samples were homogenized and subjected to immunoblotting with iNOS, eNOS or β-actin antibodies. Representative blot shows overexpression of iNOS from vessels of LPS-treated, but not of vehicle-treated animals. (B) Dose–response curves for NA-induced vasoconstriction (10 nM–10 μM) were obtained in MVA under basal conditions (CTRL), after pretreatment with compound 10, and after subsequent treatment with l-NAME and 1400W. Maximal vasoconstriction to individual NA doses (peak effect) was measured as perfusion pressure value and expressed in mmHg. (C) Duration of vasoconstriction obtained with individual NA doses (10 nM–10 μM) was calculated as area under the curve (AUC) and expressed as perfusion pressure (mmHg) × time (sec). Values were compared among curves obtained under CTRL conditions, pretreatment with compound 10, and subsequent pretreatment with l-NAME and 1400W. Results are mean ± SEM of duplicates from four independent experiments repeated for each condition. Symbols refer to significant differences between NA doses under treatment with compound 10 vs CTRL (*p < 0.05), vs l-NAME (°p < 0.05), and 1400W (†p < 0.05), respectively.

