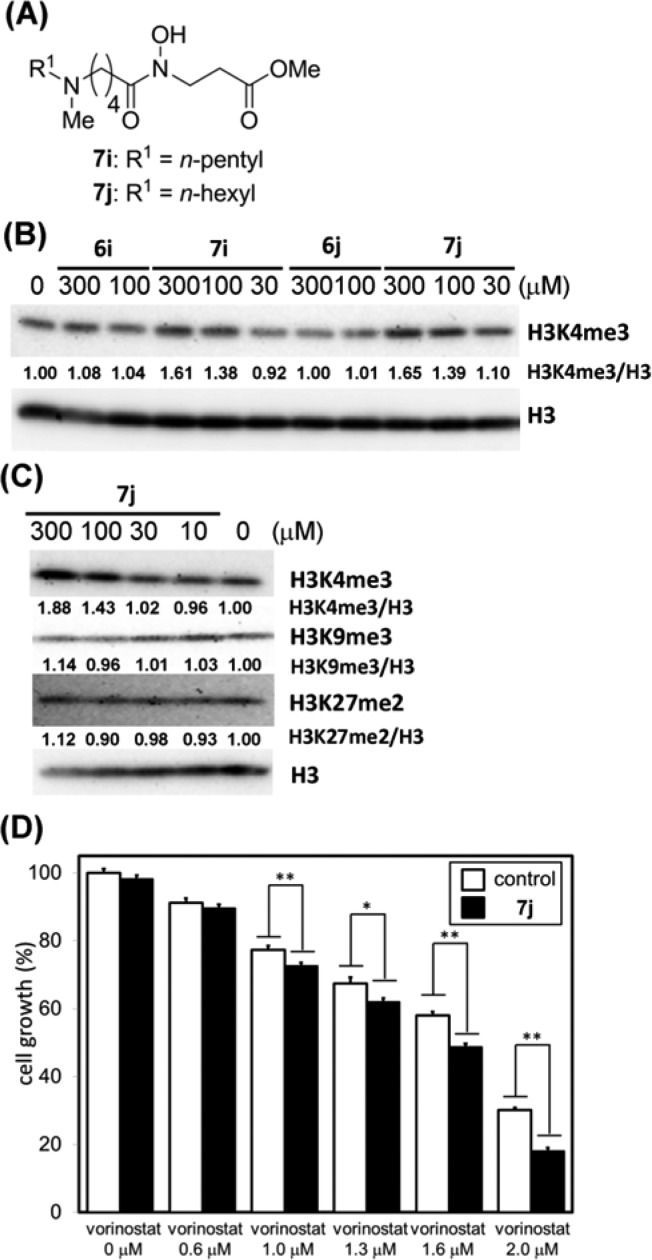
Figure 3.
(A) Structures of compounds 7i and 7j. (B) Western blot detection of methylated histone levels in A549 cells treated with JARID1 inhibitors. H3K4me3 levels after 24 h incubation with 6i, 6j, 7i, and 7j. Values of H3K4me3/H3 ratio determined by optical density measurement of the blots are shown. (C) Western blot detection of methylated histone levels in A549 cells treated with 7j. H3K4me3, H3K9me3, and H3K27me2 levels after 24 h incubation with 7j. Values of H3K4me3/H3, H3K9me3/H3, and H3K27me2/H3 ratio determined by optical density measurement of the blots are shown. (D) Cell growth inhibition of A549 cells after 72 h incubation with combination of 7j and vorinostat, an HDAC inhibitor. Error bars represent the mean standard deviation (SD) of at least three samples. Combination with 100 μM compound 7j. *P < 0.05, **P < 0.01 (Student t test).

